Samaaro + Your CRM: Zero Integration Fee for Annual Sign-Ups Until 30 June, 2025
- 00Days
- 00Hrs
- 00Min


Key Takeaways (TL;DR)
1
2
3
→
Bottom Line:
Six answers, five slides, a recommendation at the end, ready before anyone above you asks.
The readout is already built before the question lands.
It’s Thursday morning. The event wrapped Tuesday. A message lands from two levels up: how did it go? You have a folder of exports, a badge-scan file, a survey still trickling in, and a spreadsheet you don’t fully trust. What you don’t have is an answer you can send in ten minutes.
Here’s what leadership rarely says out loud: the answer is smaller than most reports assume. They want six things from an event readout: the business outcome, the cost against the return, where the deals stand, a short read on sentiment, an honest note on what worked and what didn’t, and a recommendation. Know those six, and the report stops being a research project.
It rarely takes three days because of the writing. The pieces live in five tools and a spreadsheet nobody trusts, so gathering them is the whole job. Ahead: the six answers, how to lay them out slide by slide, and a template so you never start from a blank page.
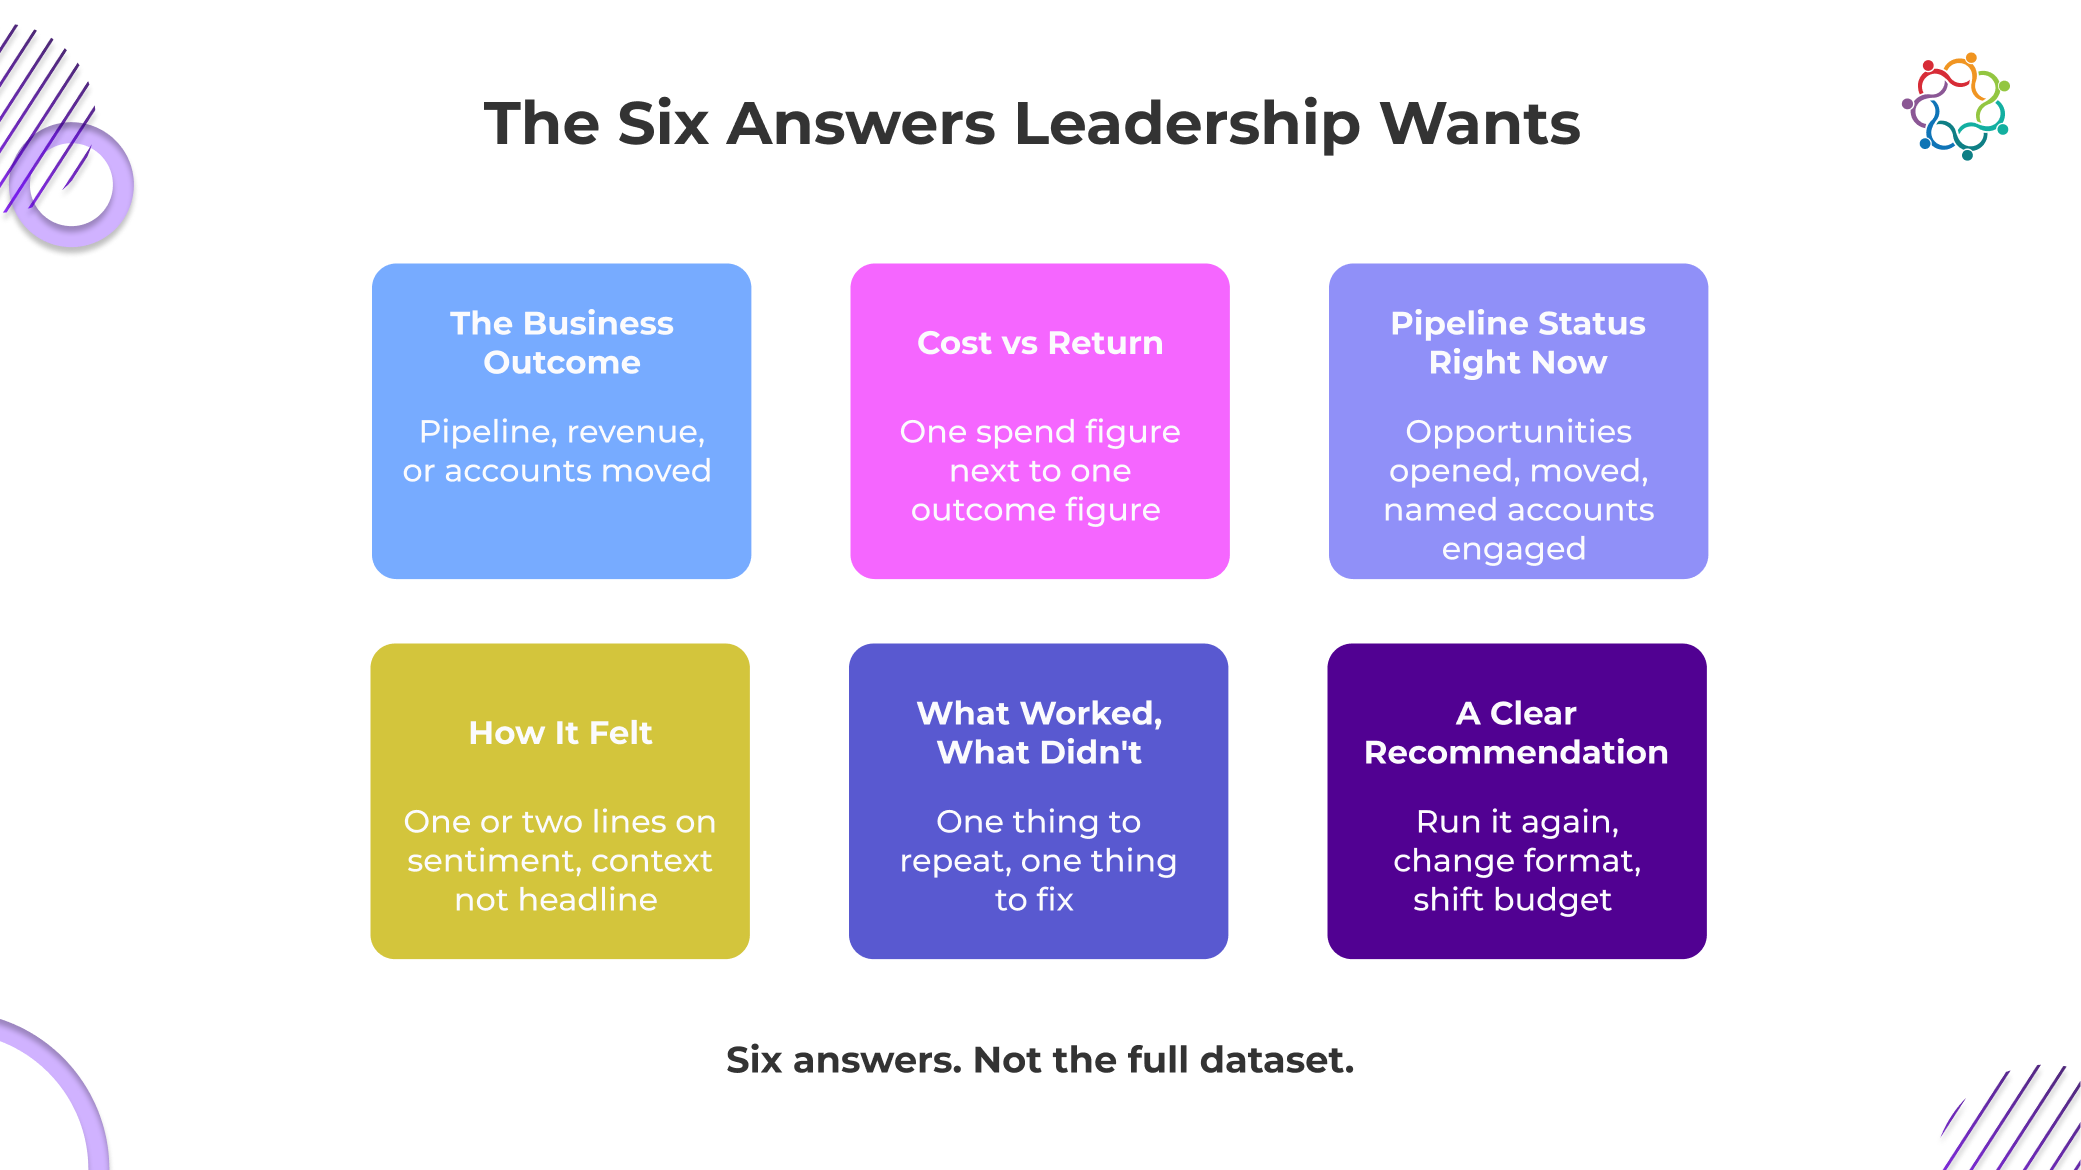
Most event reports fail for the same reason: they show everything the team tracked instead of the few things the person reading has to know. Get the list right and the report almost writes itself. Here are the six, in the order they belong on the page.
Not attendance, not impressions, not scans. What did this event do for revenue, deals, or named accounts? This is the headline, and it belongs at the top, not on slide six, where nobody scrolls to find it. If a leader reads only one line, this is the line.
One clean cost figure next to one clean outcome figure. When the two sit side by side, the efficiency reads in seconds and nobody has to redo the math you already did. Side by side is doing the work here; the moment those numbers land on separate slides, the comparison is gone.
New opportunities opened, existing ones that moved forward, and the named accounts that engaged, current and specific, with no guesswork. If the event drove new deals, but nothing has closed yet, report the leading indicators that point to revenue, rather than a closed number; the calendar guarantees are still zero.
One or two lines on attendee sentiment or feedback, kept deliberately brief. This is context, and it earns its place only when it stays short. A full paragraph here is a signal that you are reaching for something positive to fill space.
One thing to repeat, one thing to fix, stated plainly. A report that names a weak spot is trusted more than one that reads like a victory lap, because everyone in the room knows no event is flawless, and that honesty is what makes the rest believable.
Run it again, change the format and shift the budget. Leadership does not want to draw this conclusion on your behalf; they want you to hand it over, already made. The recommendation is the reason the report exists, and it is the piece most people forget to include.
Leave the rest out. Treating the report as a place to prove how much you tracked is the fastest way to bury the six answers that matter. A readout that shows all the data looks thorough on the way in and reads as noise on the way out. Report the six and keep everything else in the appendix nobody opens.
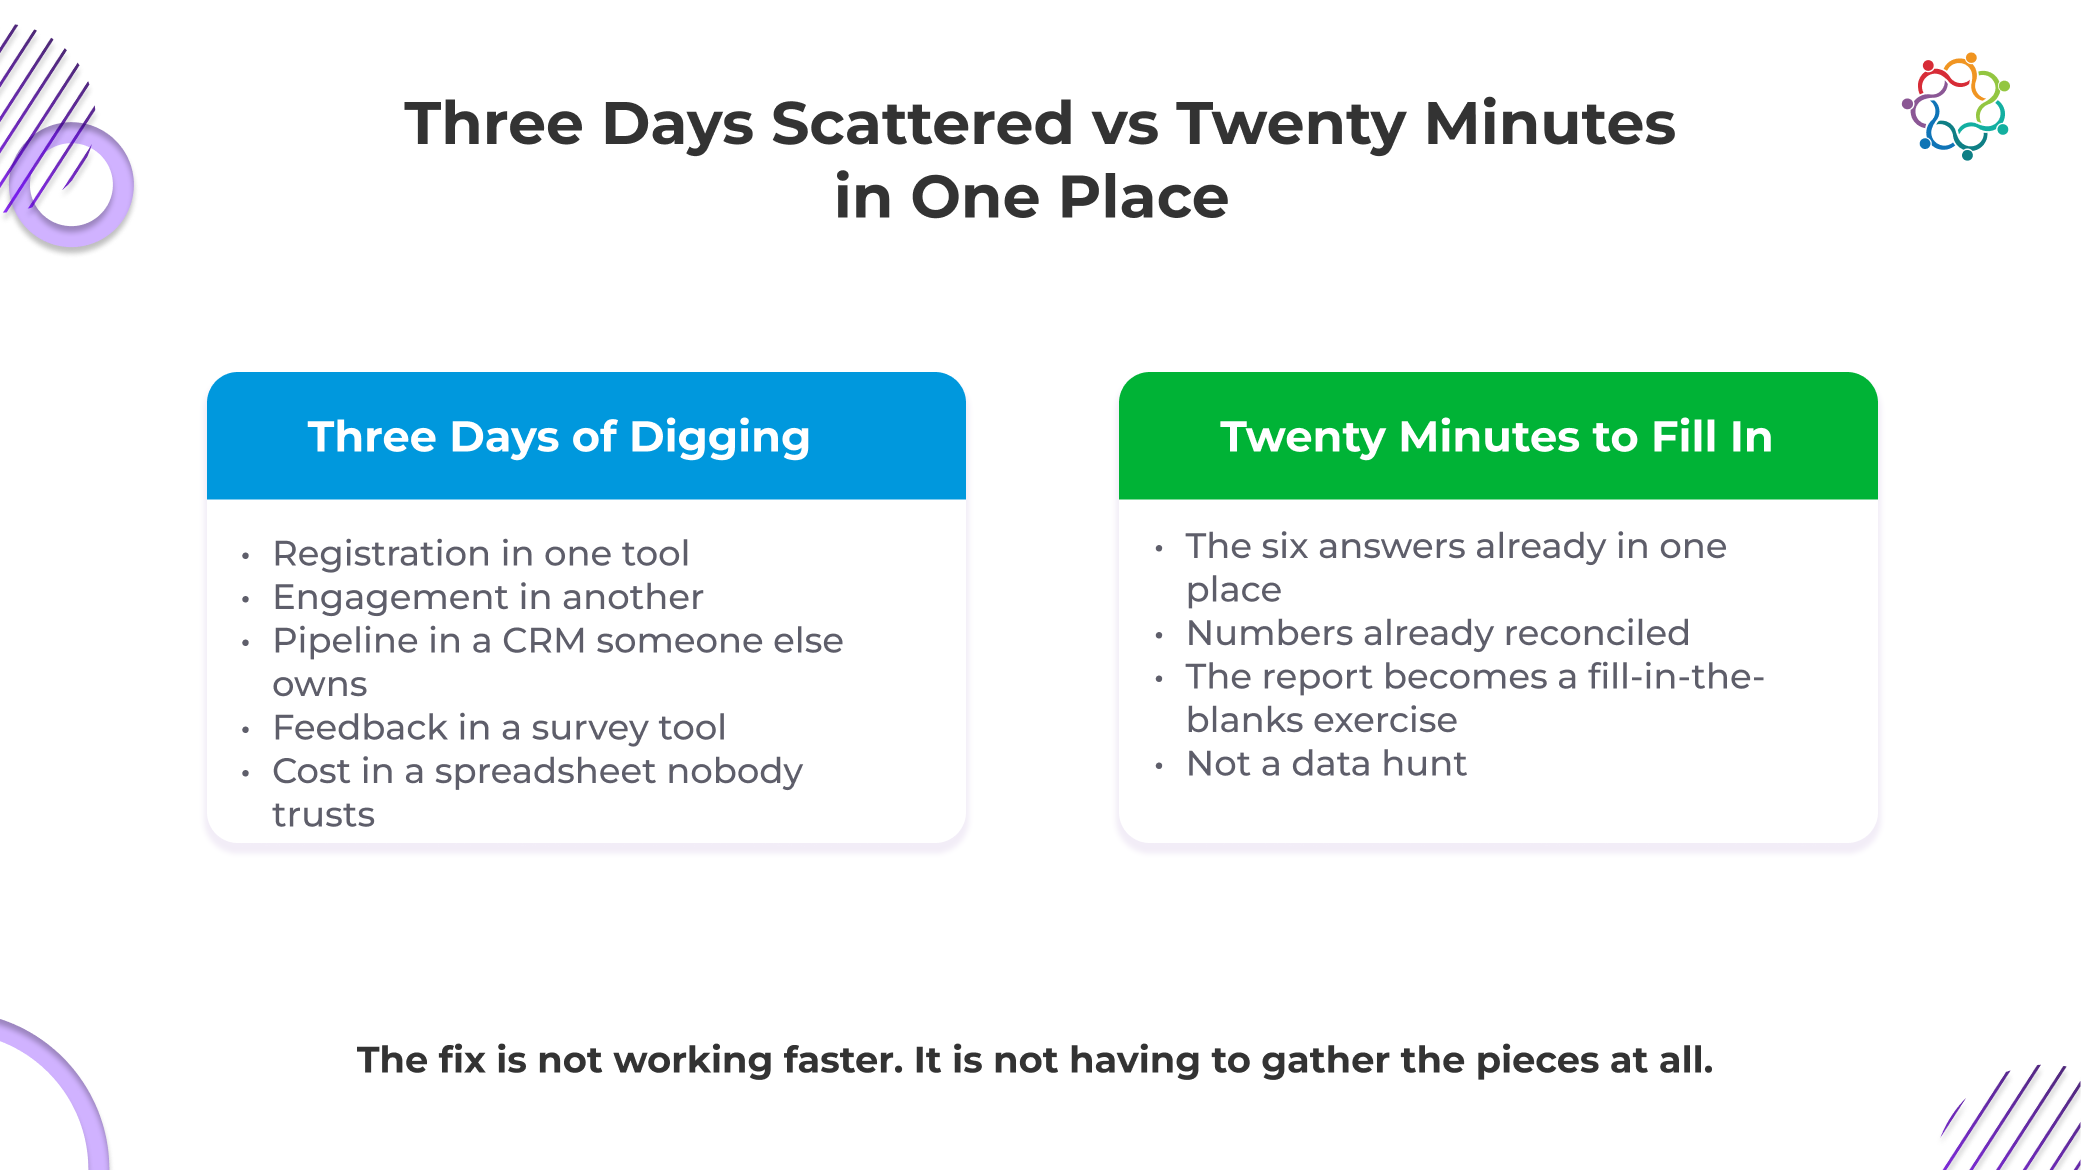
Look at where the six pieces usually live. Registration sits in one tool. Engagement sits in another. Deal data sits in a CRM that someone in sales owns and you have read-only access to. Sentiment sits in a survey tool. Cost sits in a spreadsheet that a finance partner updates on their own schedule.
Six answers, five logins, and a reconciliation step before a single slide gets built. That is where the three days go. And the pull of manual data work is not unique to event teams: in a 2022 Treasure Data survey of 500 senior marketers, respondents reported spending an average of 14.5 hours a week just managing customer data collection, and nearly one in five (18%) spent over 20 hours on it.
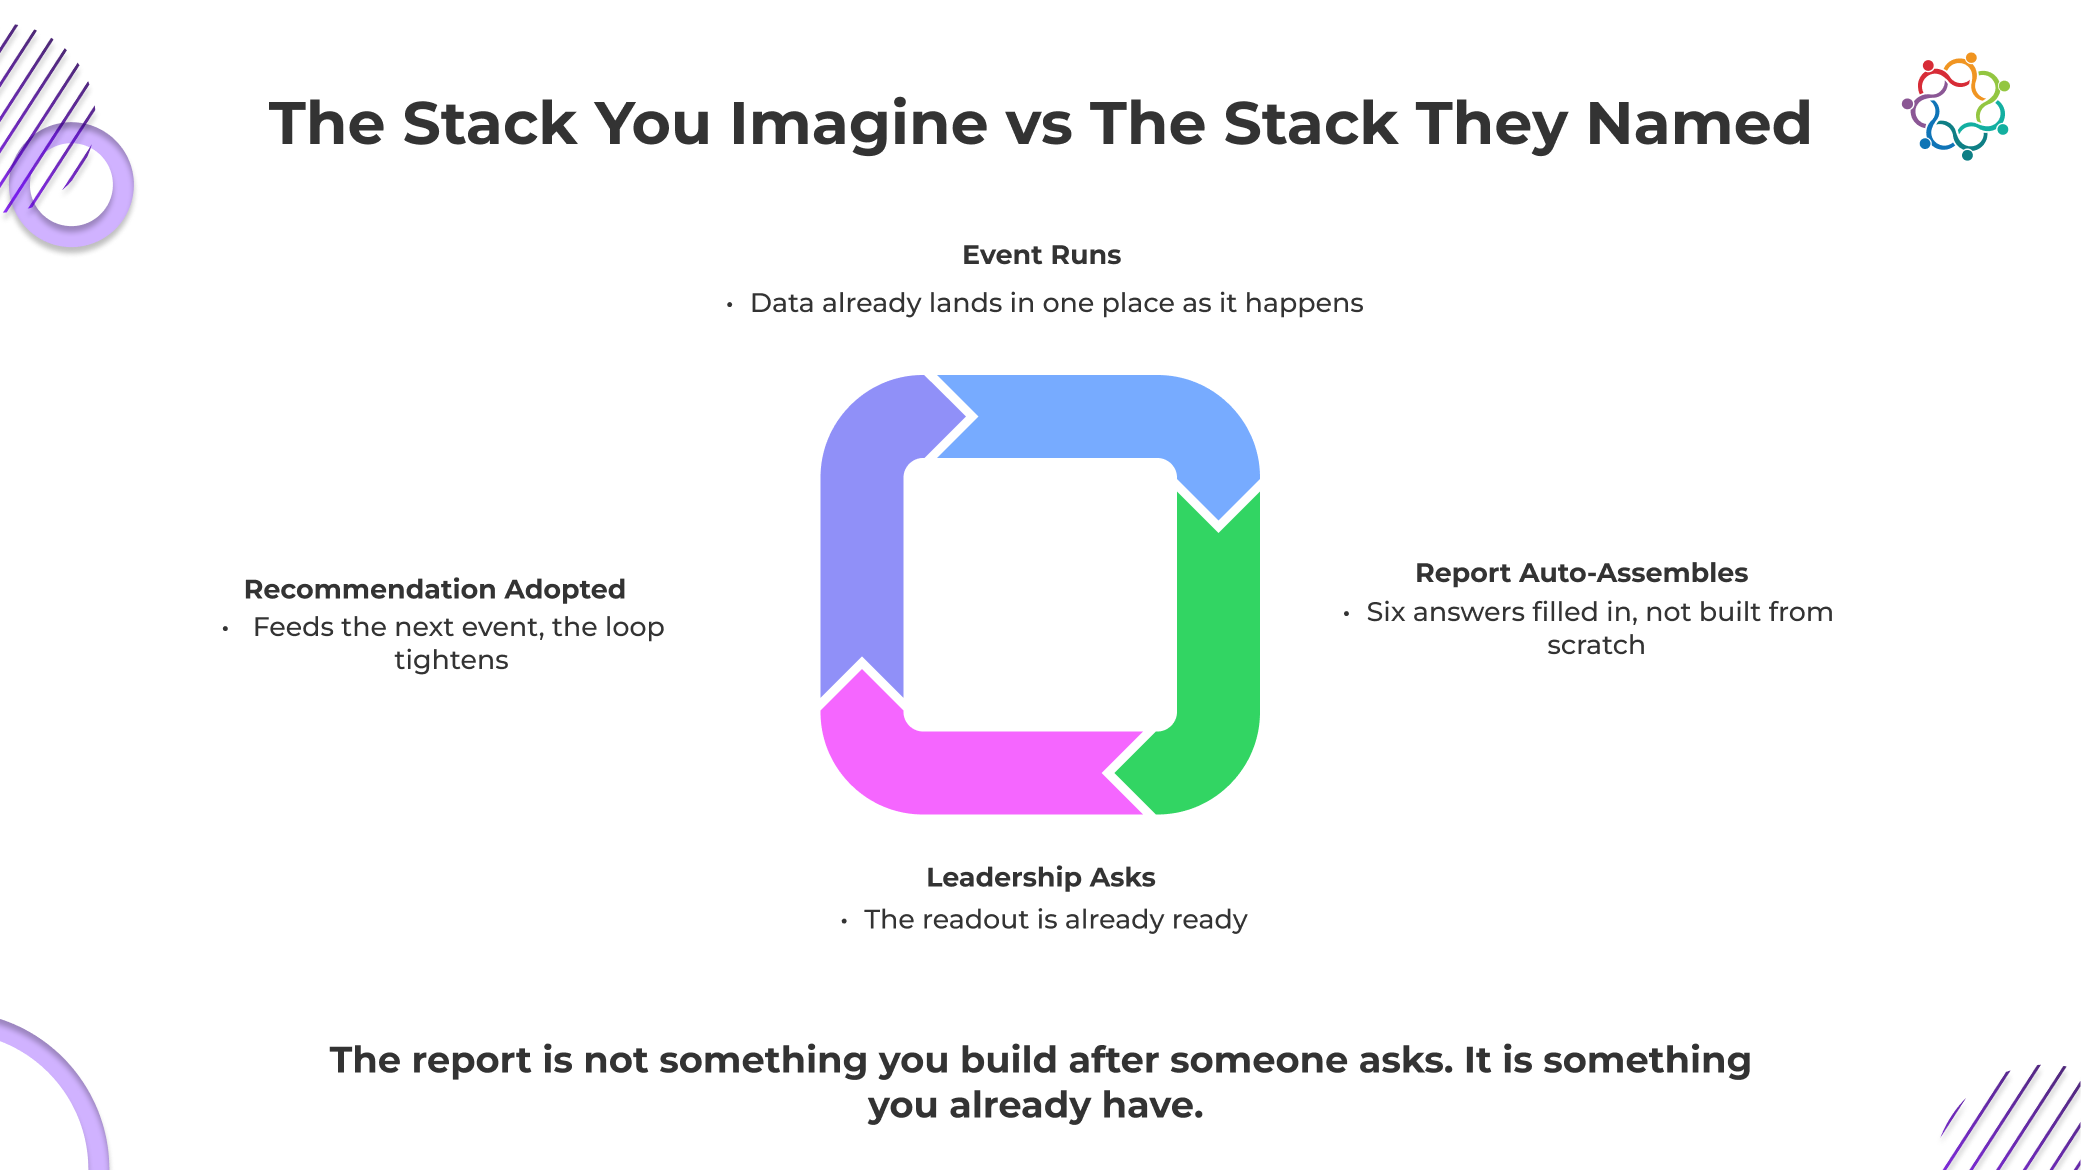
The real fix has nothing to do with working faster. When the event runs on a single event marketing platform, the six answers already sit in one place, so building the report becomes a fill-in-the-blanks exercise instead of a data hunt. For the pieces that have to stay in your CRM or your finance sheet, integrations keep them flowing into the same view, so you’re reading one screen rather than stitching five together by hand.
Here is how the six answers become a document a leader can read in under two minutes.
That’s six answers on five slides, by design: the honest read and the recommendation share the final slide because a weakness and the decision it drives belong in the same breath. One idea per slide, plain language throughout, readable start to finish by someone seeing it cold. The principle underneath the layout is a structured story over a data dump, the same discipline behind a strong post-event evaluation report.
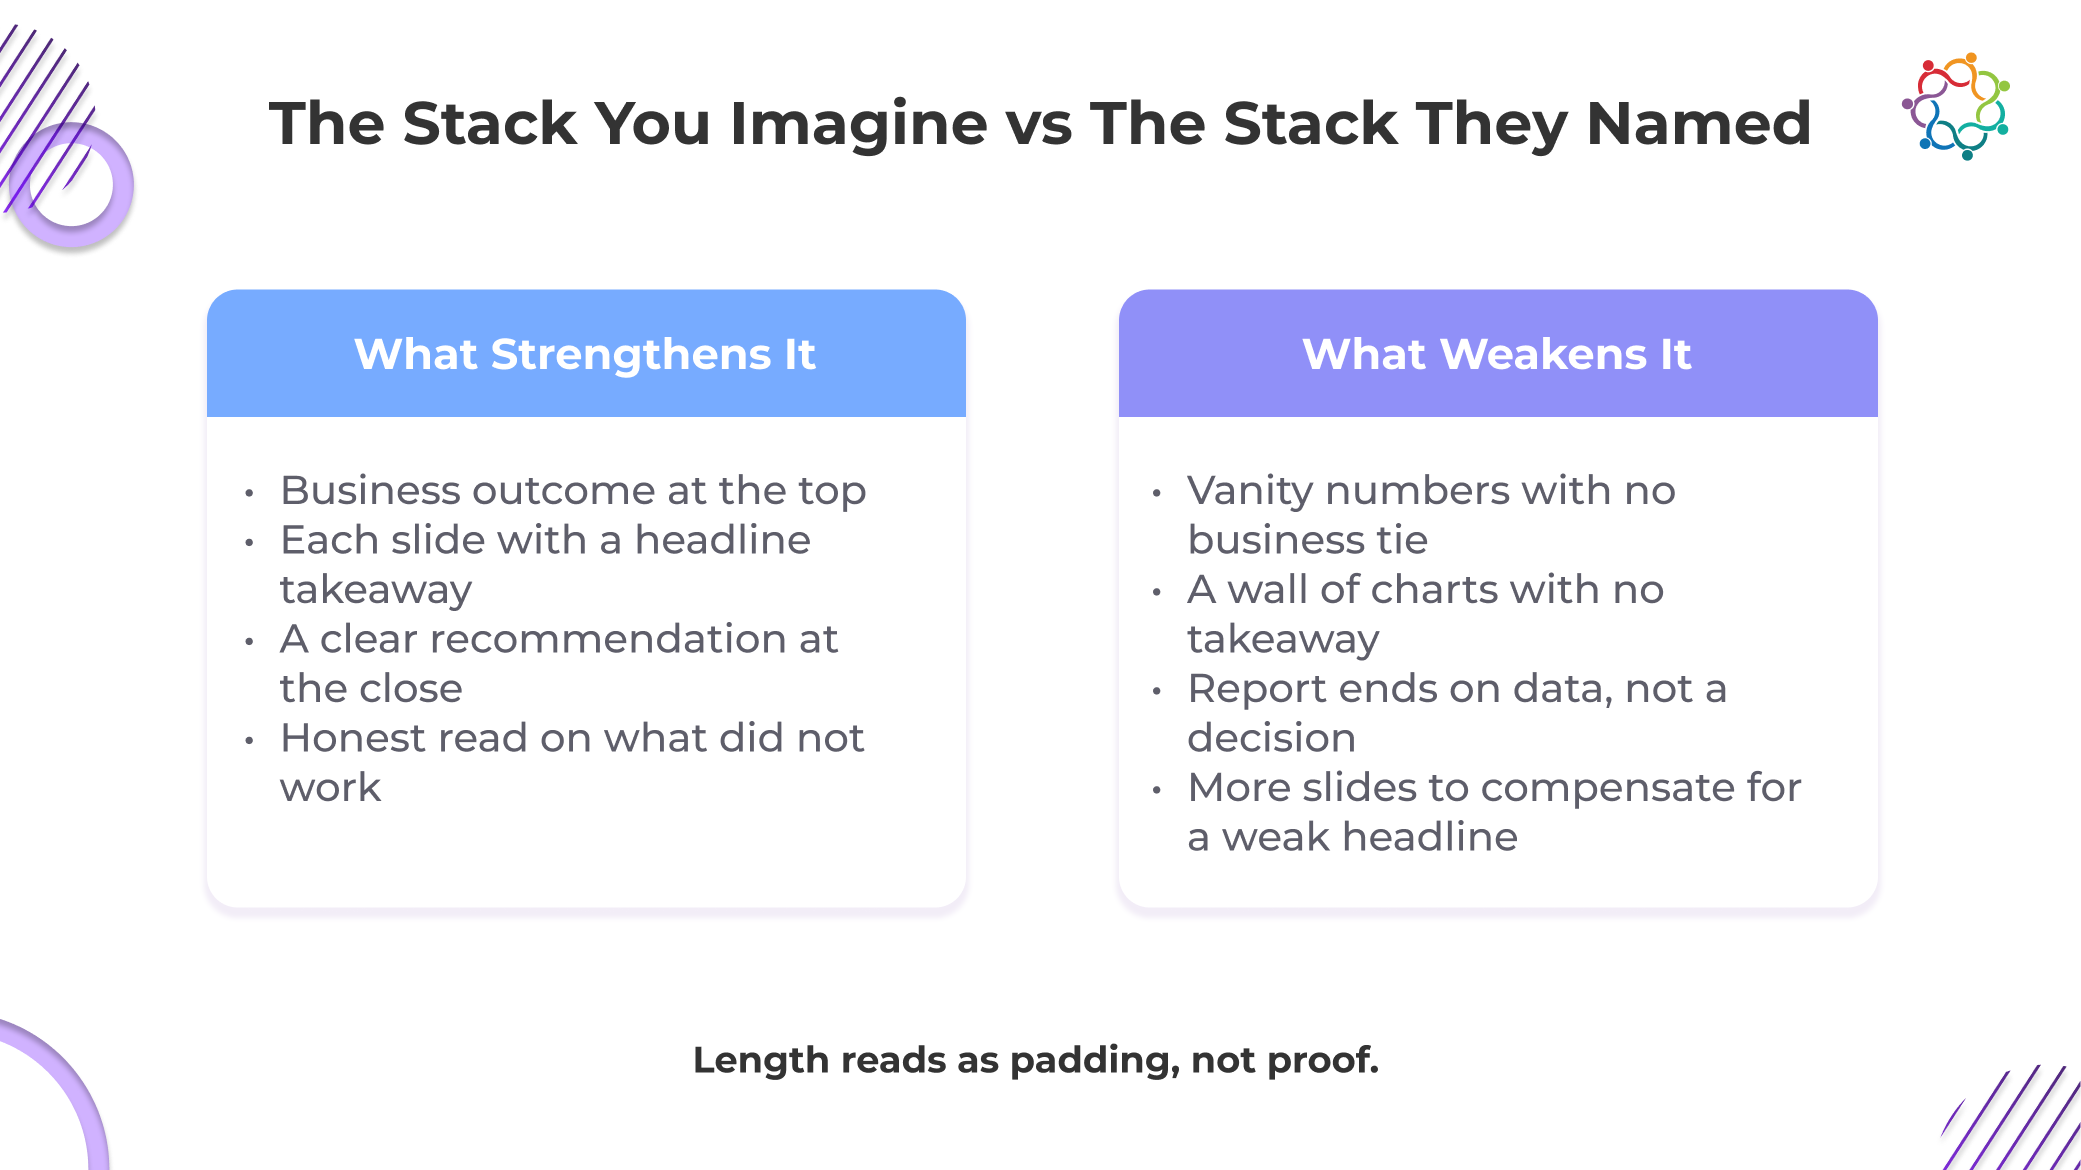
A report is as much about what you leave out as what you put in, and three habits weaken it fast.
The first is vanity numbers with no business tie: total impressions, total scans, total registrations, shown on their own. They pad the deck and dilute the six answers that matter, and the metrics that earn a place in a leadership report are a short list, not the full export. The second is a wall of charts with no headline. If a slide needs you to explain it out loud, it hasn’t done its job on the page. The third is quietly the most costly: ending on data instead of a decision, which hands leadership the thinking you were supposed to do. That is the whole difference between reporting the numbers and recommending something from them.
And resist the pull to add slides when the headline number feels soft. It never reads as thorough. Length reads as padding, and padding quietly tells the room you couldn’t find the proof.
Six answers, one page or a handful of slides, and a recommendation at the end. That’s the entire report, and it holds up in front of anyone above you because it was built to answer the one question they always ask.
So the next time that Thursday message lands, you don’t start digging. You open the file that is already there.
Everything above comes pre-built in the Executive Event Report template: an editable slide deck laid out in the order leadership reads it, plus a one-page printable summary for the times a deck isn’t the right format. Download it below. It takes your first name, work email, company size, and role.
To see the six answers come together while the event is still running, book a walkthrough.