Samaaro + Your CRM: Zero Integration Fee for Annual Sign-Ups Until 30 June, 2025
- 00Days
- 00Hrs
- 00Min

1
2
3
→
Bottom Line:
Four slides, fixed order: spend, signals, accounts, and a forward line naming the expected close window.
The recap that holds up before the revenue does.
Your event ended eight weeks ago. The QBR is on Thursday. Sales has twelve opportunities in motion from the floor, but the cycle typically runs four to six months, so none have closed. Your CRO opens the review by asking what the event brought in. You have a designated budget for spending, a record of attendance, and a photo wall. You do not have the one number being asked for.
Here is how to report event marketing ROI when the closed-revenue number is not in yet: report the leading indicators that predict it. The qualified conversations the event created. The opportunities it opened and moved forward. The named accounts it advanced. And the date the revenue is expected to land. That is a recap that holds up under the hardest question in the room.
Closed revenue is a lagging indicator on a cycle longer than your reporting window, so a recap built only around it looks empty too early. What follows is what to put in the recap, slide by slide, with a template you can fill in before Thursday.

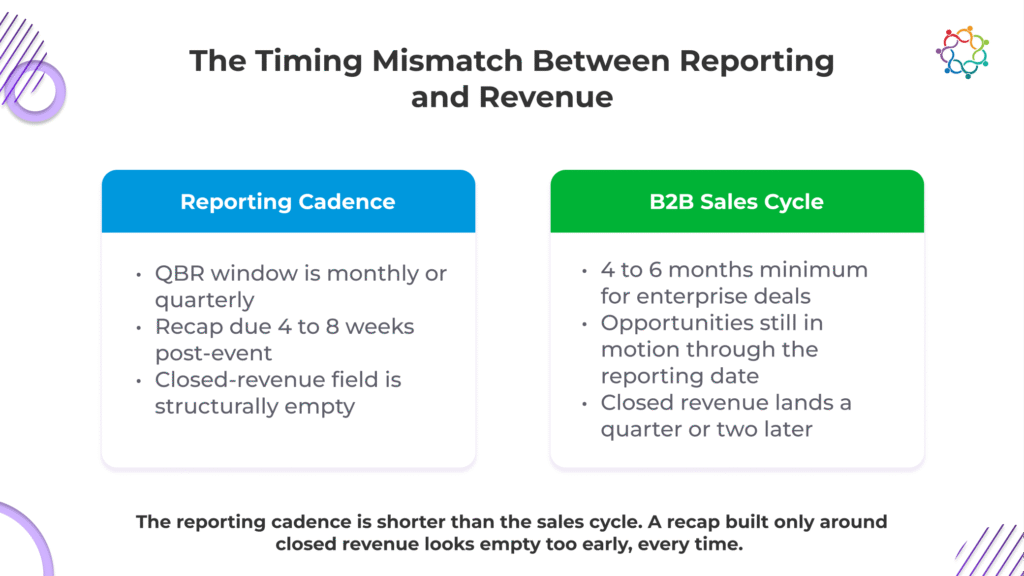
Before any tactics, reset the model. The reporting cadence at most companies is monthly or quarterly. A B2B sales cycle is longer than that. Ebsta’s 2024 B2B Sales Benchmark Report, an analysis of more than four million sales opportunities, found B2B sales cycles running 38 percent longer than they did in 2021. Norwest’s 2024 benchmark puts larger deals, those over $100K, at six to nine months or more from first conversation to signature. Put that against a quarterly cadence, and the closed number for this event will not exist on the day the recap is due.
That changes what the recap is for. Its job is to report whether the deal is in motion, because motion is the honest, available signal this quarter and it is what predicts the eventual result. Leadership already accepts this logic everywhere else it spends, since paid media and outbound both report pipeline influenced long before the revenue lands. Events get held to a revenue standard the other channels are spared, usually because they have been reported badly, led with a closed number the calendar guarantees is still zero. (Our B2B Field Marketing Playbook covers where events sit in the wider program.)
That is the trap to avoid. When you open the recap with closed revenue as the headline, a working event reads as a failed one, and you have handed leadership a clean reason to cut the budget. Lead with the leading indicators of event ROI instead, the signals that predict revenue, because the result itself is still a quarter or two away.

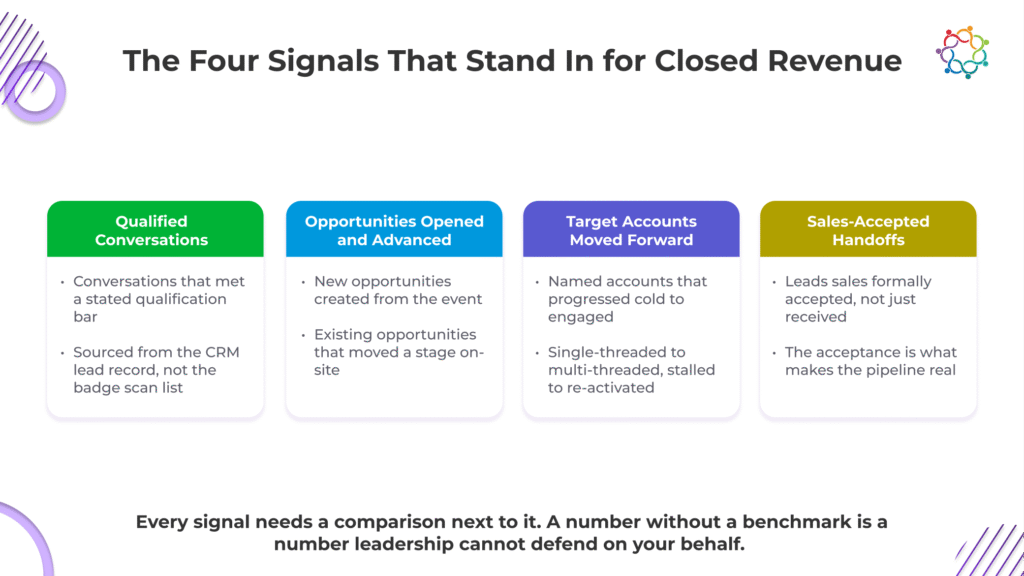
If you are wondering what metrics to report after a B2B event when nothing has closed, start with four signals. Together, they are how you report event ROI to leadership before the revenue lands, because each reports intent, the closed number cannot yet be shown.
The practical question is how to pull these without losing a week to it. Each number already lives somewhere: the CRM stage, the opportunity record, the account history. The work is naming where, then reading it out. Today that step is often manual. As one demand generation leader at a large B2B company put it, “Manual effort. Pull Dynamics. Pull closed-won. Then match.” The less of that the recap requires, the faster it gets built and the more often it actually gets done.
A note on scope. These four signals are the artifacts you report in the recap. They are a different thing from the questions in our guide to the 10 questions to ask in your post-event debrief, which are the conversations to have with your team after an event. Different artifact, different audience, different moment: the debrief sharpens your read internally, and the recap reports the result upward.
One more discipline. Reporting raw volume that never qualifies, total scans, total registrations, total footfall, then calling it pipeline, inflates the number in a way sales will not back, and the first hard question collapses the recap. Report the qualified signal and leave the gross count out.
A signal on its own cannot be judged. Thirty opportunities are strong, average, or weak depending on something a bare number does not show, and when the slide leaves that gap open, leadership fills it with skepticism. Every number needs a reference point.
There are three comparisons worth using. The first is against your own past events: whether this result sits above or below your track record for similar formats. The second is against a non-attending baseline: how the accounts that attended are progressing compared to comparable accounts that did not. That is the sharpest read on what the event itself added. The third is against the cost, the signal beside the spending it defends, so the recap answers the budget question in the budget’s own terms. (Our Event Sponsorship Measurement Framework applies the same comparison logic to sponsored events.)
The discipline is restraint. One comparison per signal, chosen to make that signal legible, keeps the slide readable. Three comparisons stacked on every number turn a recap into a spreadsheet and lose the room.
The trap here is the bare absolute. Present a number with no reference point, and the reader nods politely; leadership genuinely cannot tell whether it is a win, and the whole recap reads as activity rather than impact. A number leadership cannot place is a number it cannot defend on your behalf, which is the entire reason the recap exists. This is also how you defend an event budget without closed revenue: the comparison does the proving.

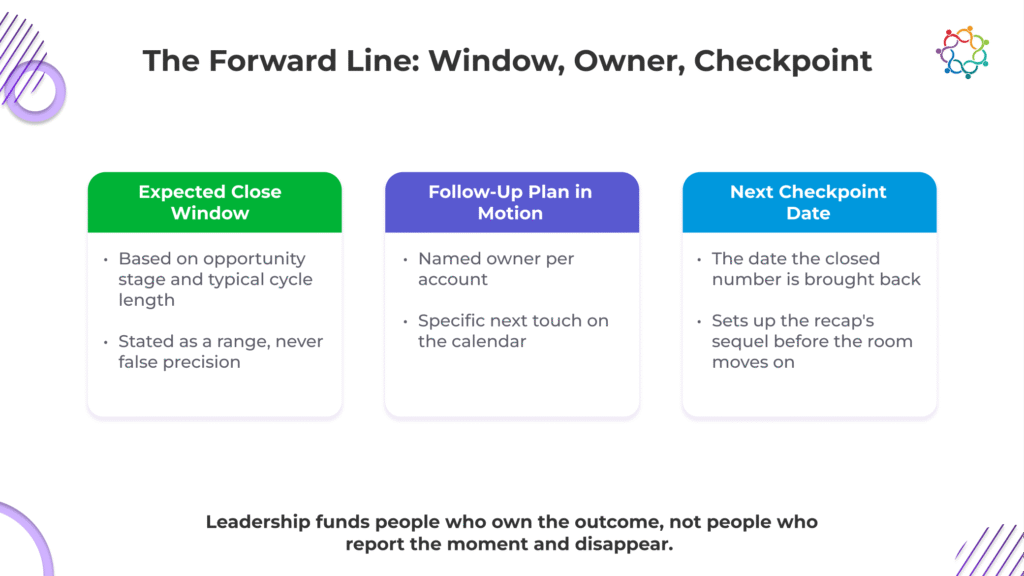
The missing closed number is the recap’s biggest vulnerability, so address it head-on rather than hoping nobody asks. “No closed revenue yet” is a weak line. “Here is when the closed revenue is expected, and here is the plan to land it” is a strong one. Same facts, opposite read.
The forward line has three parts:
This lands because it shows you are tracking the deal all the way to revenue. Leadership funds the people who own the outcome and grows wary of the ones who report the moment and disappear. The forward line tells them who you are.
The trap is leaving the timeline vague. A phrase like “deals are progressing,” with no window and no checkpoint, reads as “we do not actually know whether this will convert,” which is precisely the doubt the recap is supposed to remove. Give the date. Showing event impact before deals close depends on it.

Now lay it onto four slides that a leader can read in ninety seconds, about how long an event recap slide for a QBR gets in a packed review.
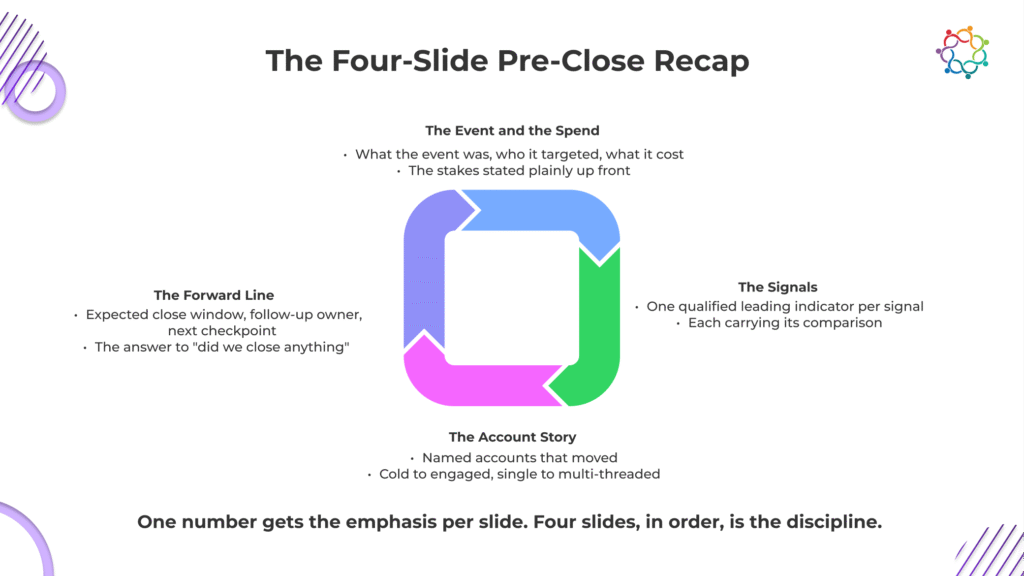
The first slide states the event and the spend: what it was, who it targeted, what it cost, framing the stakes of the three that follow. The second slide carries the signals from above, one number per signal, each with the comparison that gives it weight. This is the core of the deck, the slide that everything else supports. The third slide tells the account story, the handful of named logos that moved and how, because leadership remembers accounts long after it forgets aggregates. The fourth slide is the forward line: the expected close window, the follow-up owner, and the next checkpoint date.
Three rules hold the deck together. One number per slide gets the emphasis and the rest plays support, so the eye always knows where to land. The order stays fixed, spend then signals then accounts then forward, because that sequence walks leadership from the question they asked to the answer you are giving. And the whole thing stays skimmable in ninety seconds, the real constraint a QBR slide is built against.
The trap is the dense ten-slide recap that opens on an agenda and a photo wall and buries the one slide leadership needs. Length reads as padding, a signal that you could not find the real proof and reached for volume to cover it. Four slides in fixed order are the discipline, and it is the entire event marketing report template for a QBR: spend, signals, accounts, and forward.

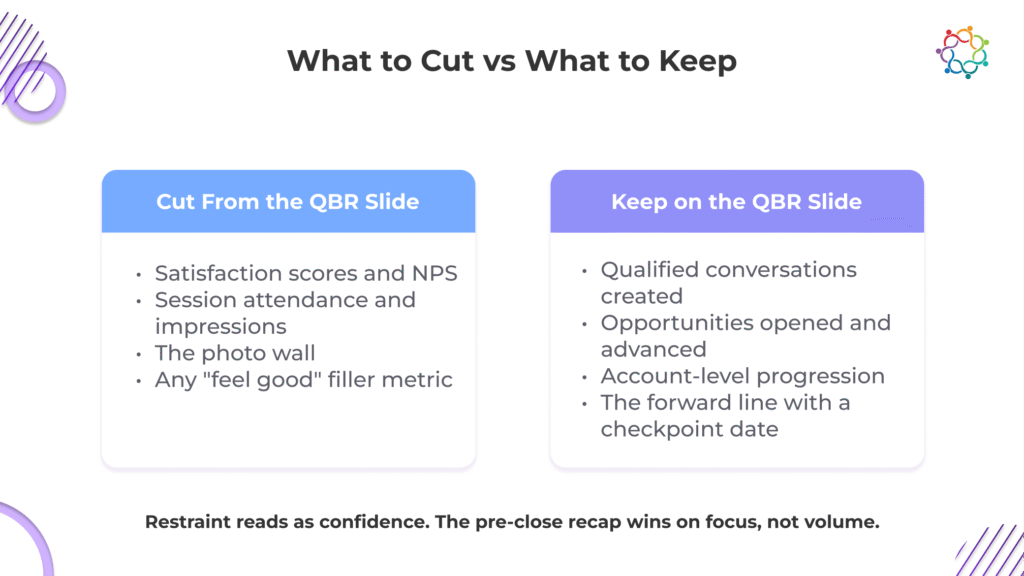
Four good slides can still be undone by one weak instinct, so here is what to cut and why each hurts in this specific moment.
Padding backfires for a reason. Stuffing the deck with feel-good metrics tells leadership you do not have the real proof, while restraint reads as confidence. A recap that reports four defensible numbers is stronger than one that reports fourteen soft ones.
It also helps to be honest about what booth volume represents. One marketing leader at a B2B software company called the scan-for-giveaway ritual exactly what it is: “swag-for-email.” Scans collected that way say little about intent, which is why they have no place on the slide that defends your budget.
Then field the live question without flinching. When the CRO asks whether you closed anything, the answer is already on slide four: not yet, here is the expected window, here is the next checkpoint. Because the recap already contains the answer, the question stops being a threat. That is what to show leadership after a B2B event: four numbers that hold up and a forward line that owns the rest.
Report the signals that predict revenue, give each one a comparison, commit to a date, and fit it on four slides. That is a recap that survives the room when the closing number is still months out.
The recap is not where you confess that nothing has closed yet. It is where you show the deal is already moving and tell them exactly when the number arrives.
Everything above comes pre-built in the Four-Slide Event Recap Template, ready to fill in before Thursday, along with a one-page leading-indicator reference so you know which numbers to pull and where they live. Download the template below. It takes your first name, work email, company size, and role.
To see how Samaaro captures these signals as your event runs, book a walkthrough.

Samaaro is an AI-powered event marketing platform that enables marketing teams to turn events into a measurable growth channel by planning, promoting, executing, and measuring their business impact.
Location


© 2026 — Samaaro. All Rights Reserved.