Samaaro + Your CRM: Zero Integration Fee for Annual Sign-Ups Until 30 June, 2025
- 00Days
- 00Hrs
- 00Min

1
2
3
→
Bottom Line:
The cheapest tool that fragments your stack is the most expensive choice once everything is counted.
Add up what your event software costs and the number looks manageable: six subscriptions, each a line-item finance signed off on, none outrageous on its own. That subscription total is only a fraction of the real event marketing software cost of running events on six tools. The real cost is the six fees plus three hidden costs no one totals: the hours your team spends moving data between the tools, the leads that slip through the gaps between them, and the return you cannot prove because the data is scattered across all six.
Those three hidden costs are usually the largest part of the bill, and they are exactly the part consolidation removes. Put the whole stack on one platform, and the subscription line shrinks, yes, but the bigger saving is in the hours, the leaks, and the proof.
This piece walks all four cost categories, gives you a way to put your own numbers against each one, and shows what one platform takes off each. The figures along the way are illustrative. The real answer is your own math, run against your own event volume, team, and lead values, and by the end you will see which part of it one platform actually erases.
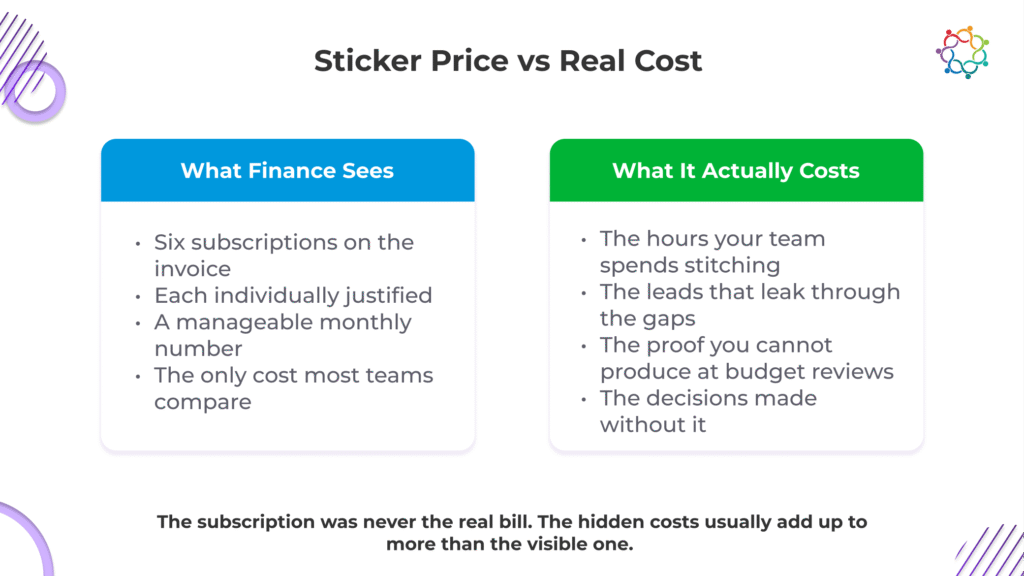
Most teams evaluate event tools the way they evaluate any subscription: by the monthly price. Each tool gets justified on its own sticker, finance approves the line, and the stack grows one reasonable decision at a time. The problem is that a sticker price and a total cost of ownership are different numbers, and only one of them is on the invoice.
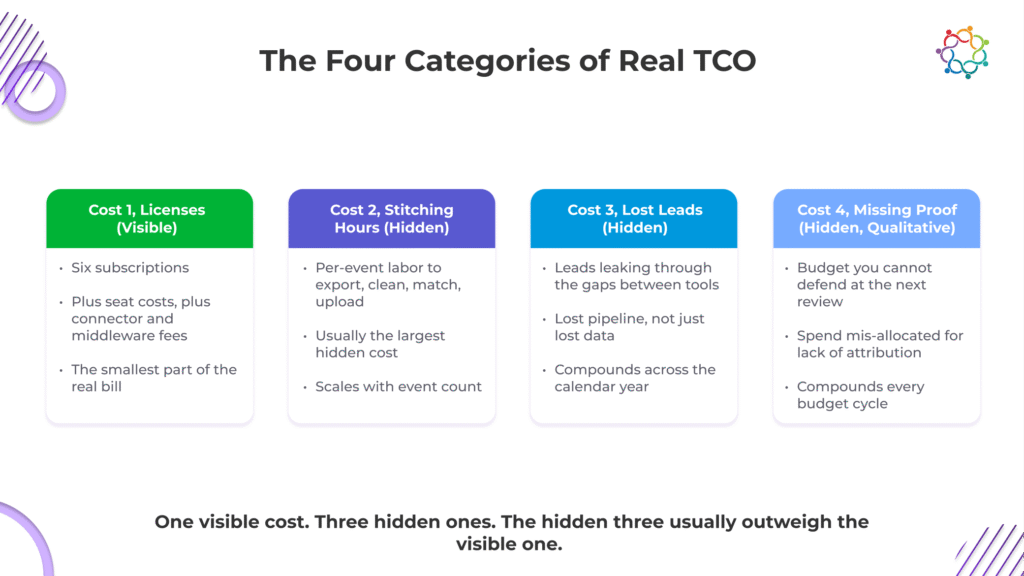
The total cost of ownership for an event stack has four parts. One is visible and three are not:
The reason the hidden three get ignored is that they do not behave like a subscription. A license is a fixed, visible, annual number. Ops time, leaked leads, and the proof gap are diffuse, recurring, and uncounted, so they are easy to wave off in the moment and large once you add a year of them together. The trap is justifying the stack tool by tool, each one cheap, each one needed, while never adding up what it costs to run them together. A fragmented stack costs more than the sum of its subscriptions, and the rest of this piece is how to find that number, then net it against one platform.
Start with the part you can see. Six tools, six subscriptions, the line items finance already tracks. Even this number, the easiest one to pin down, tends to come in low, for three reasons.
First, overlap. When you run several tools, you usually pay twice for the same capability: two systems that both send email, two that both build forms, two that both store contact data. You are buying the same feature more than once. Second, seats. Most of these tools are priced per user, so the license cost climbs every time the team grows, in a way that a single headline price hides. Third, the connective tissue. Making six tools talk to each other often means middleware, paid connectors, or an integration platform, and almost no one counts that as part of their event software cost, even though it exists only because the stack is fragmented.
To tally this category honestly, add the subscriptions, plus per-seat costs across the team, plus any connector or integration fees, plus per-event add-ons. There is also waste baked in. Gartner’s 2025 Marketing Technology Survey found organizations actively use only about half of their martech, with utilization down to 49 percent, so a real share of the license bill buys capability no one touches.
Licenses are still the smallest of the four costs. They matter here because even the visible number is bigger than the headline suggests. On one platform, one subscription replaces several, the overlaps disappear, and the connectors become unnecessary, since there is nothing to connect. How much that saves depends on your own math, so run it rather than borrowing a figure.
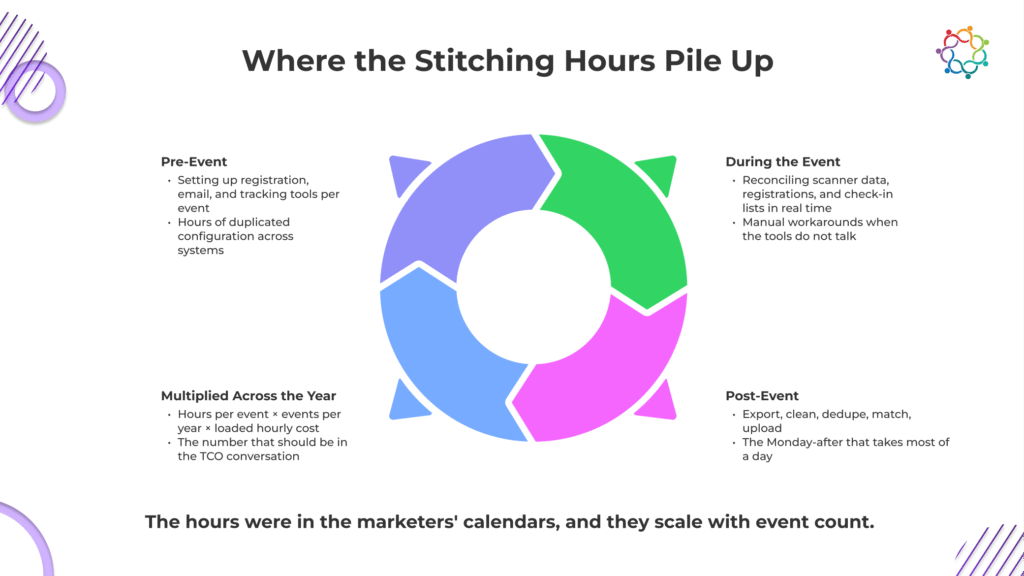
This is the cost that usually dwarfs the rest, and it is the one least likely to appear in any budget. After every event, someone exports the registration list, the check-in scans, and the lead capture, then cleans them, matches records across systems, reconciles the duplicates, and re-enters the result where it needs to live. That work happens for every event, all year, and it is pure overhead.
To put a number on it, the method is simple: hours spent stitching per event, times the number of events you run a year, times the loaded hourly cost of the people doing it. Run that with your own figures and the total tends to surprise people, because three things make it larger than it feels. It scales directly with event count, so it grows as your program grows. It pulls your most capable marketers into data entry. And it stays invisible because everyone treats it as just part of the job, never as a line with a cost.
Underneath the hours is a second layer: the work that did not happen. Every hour moving data is an hour not spent on a campaign, content, or a relationship. In the conversations behind this cluster, that was the most consistent complaint: the person who should be building the program spends the days after each event moving data between systems by hand instead. The automatic version of that work, where capture, sync, and routing run on their own, is exactly what a single connected platform removes, so the highest hidden cost falls toward zero. The hours you get back are, again, your own to calculate.
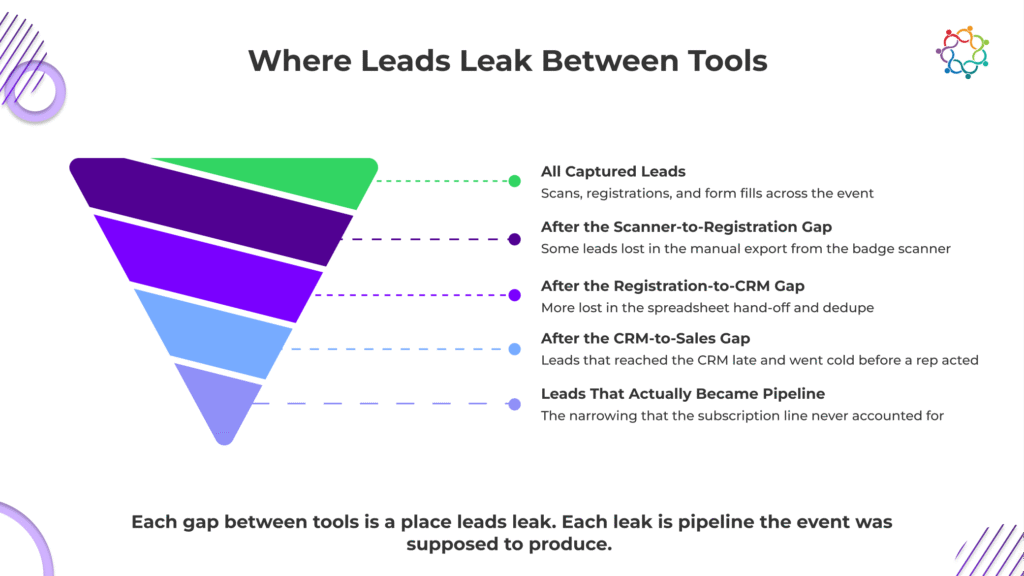
The third cost is the pipeline that leaks out between the tools. A booth lead gets captured on a scanner and never makes it into the CRM. A hot handoff sits in a queue while someone is traveling, and by the time a rep follows up, the moment has passed. Each of those is a captured lead that turned into nothing, which is to say, lost pipeline you already paid to generate.
To size it, estimate the share of your captured leads that never convert because of the gaps, then multiply by the value of a lead, or by your average deal value and conversion rate. The exact share is yours, but the structure is what matters. Even a modest leak rate, applied across a full year of events and a large volume of leads, adds up to real pipeline.
What makes this a fragmentation cost rather than a selling problem is where the leak happens. The path between tools is manual and slow, so it leads to a handoff or vanishes in an export, regardless of how good the team is at working them. This is the leakage that happens on the way from the booth to the CRM, and it is structural rather than a matter of effort. Close the gaps, and the leak shrinks. On one platform, there are no inter-tool handoffs for a lead to fall through, capture lands in the CRM as it happens, and the pipeline you recover is the pipeline you were already losing. How much you recover is your own number to run.
The fourth cost is the one you cannot put a clean number on, which is exactly why it gets left out. When event data is scattered across six tools, you cannot show, cleanly, what your events actually produced. This gap has no line on any invoice. The cost lands downstream: programs are underfunded because no one can defend them, budget cuts from the events that were quietly working, and spend decided on instinct because the evidence cannot be assembled in time.
Think about it in two parts: the budget you lose, or fail to win, because you cannot prove the return, and the spend you misallocate, guessing which events work. Both are real and both are felt, even if they resist a precise figure. This one stays qualitative on purpose. Putting a fabricated number on the cost of flying blind would be its own kind of dishonesty.
It belongs on this list because it is a fragmentation cost at the root. The reason you cannot prove the return is that the data never lived in one place to begin with. And it compounds: every budget cycle you cannot defend the program is a cycle where the strongest events lose ground to the ones that merely sounded good in a meeting. These are the exact questions a CFO asks about event spend, and a fragmented stack cannot answer them. On one platform, the data is connected, so the proof exists, and the program gets defended and funded on evidence instead of argument.
Put the four together and the picture resolves. Add the licenses, the ops hours, the leaked pipeline, and the cost of the proof you cannot produce, and the real total cost of a fragmented event stack runs well past the six subscriptions you started with. The visible cost is the small one. The three hidden costs are where the money actually goes.
Here is what one platform does to each category:
The savings concentrate in the three hidden categories, which is the whole reason a subscription-price comparison gets the decision wrong. Instead of asking whether one platform is cheaper than six tools on a monthly price, ask what the entire fragmented setup costs against one platform, hours, leaks and proof included. On that basis, the answer usually flips. The exact numbers are yours, depending on your event volume, team size, and lead values, so the real output is your own total cost of ownership rather than a generic figure. And the trap to avoid is the one that looks most responsible: picking the cheapest tool based on subscription price. The cheapest tool that fragments your stack is the most expensive choice you can make, once everything it costs to run is counted.
The real cost of a fragmented event stack is mostly the part you cannot see: the ops hours, the leaked pipeline, the return you cannot prove. That is exactly where consolidation pays off, in the hidden three far more than in the visible one. The six subscriptions were always the cheap part of this. The expense is everything you do to make them work together, and everything that slips away when they don’t. None of that is on the invoice, which is why the stack always looks cheaper than it is.
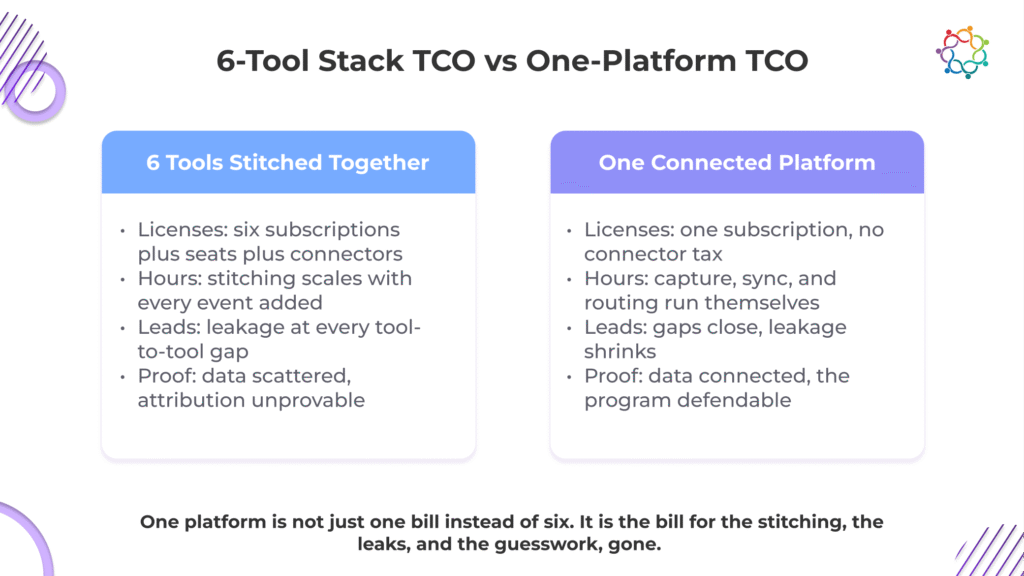
One platform is not just one bill instead of six. It is the bill for the stitching, the leaks, and the guesswork, gone.
Run your own numbers across the four costs, then see what your events would actually cost on one platform. Book a walkthrough and talk to the team about your stack.


