Samaaro + Your CRM: Zero Integration Fee for Annual Sign-Ups Until 30 June, 2025
- 00Days
- 00Hrs
- 00Min


Key Takeaways (TL;DR)
1
2
3
→
Bottom Line:
Sponsorship without measurement is a donation, and renewals based on relationships instead of data are quiet six-figure drains.
You wrote a $150K check to be the headline sponsor of an industry conference. The logo’s on the badge, the keynote slot is locked, and the lead list arrived three days after the event. Six months later, finance asks the obvious question: Did it work? You don’t have a defensible answer.
This is the position most B2B marketing leaders are in by their second sponsorship cycle. The check cleared. The event happened. But the line connecting the spend to revenue was never built, and the renewal conversation is awkward.
An event sponsorship measurement framework is what turns “we sponsored that conference” into a defensible business case. It runs across four stages: goal-setting before you sign, data capture during the event, pipeline attribution after, and scorecard reporting at the end. Unless you are doing all four, you are not measuring sponsorship. You are hoping.
This article is the framework, end-to-end, plus a downloadable scorecard template your team can use to evaluate every sponsorship in the portfolio. For the broader operating system that event programs sit inside, see Samaaro’s B2B Field Marketing Playbook.
Most sponsorship measurement breaks for two structural reasons.
First, goals get defined after the contract is signed. The check goes out before anyone has decided what the sponsorship is supposed to deliver, which means the team measures whatever the event happened to produce instead of what they needed it to produce.
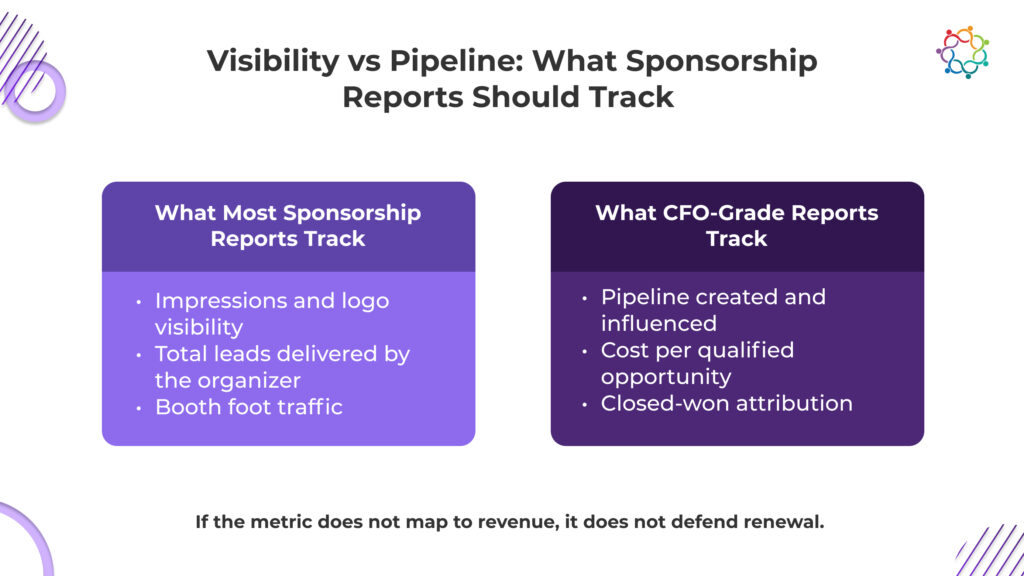
Second, the data gets captured by the event organizer, not the sponsor. The lead list shows up three days late, stripped of conversation context, and with no link to your CRM. You inherit the organizer’s view of attendance. You miss the sponsor’s view of the pipeline.
The default metrics most teams report on are downstream of these two failures: impressions, badge scans, logo placements, and lead list size. None of them maps to revenue. Visibility is not pipeline. Reach is not pipeline. Lead count is not pipeline.
The shift this framework forces is from reporting visibility to reporting pipeline. Every sponsorship report should answer three questions on a single slide: did it generate pipeline, did it move pipeline, and did it deserve renewal.
Common trap: treating the lead list as the deliverable.
The lead list is the starting point of measurement, not the end of it. A list of 800 names without conversation context, intent signals, or pipeline attribution is a CSV, not an outcome. Sponsorship value lives in what your team does with that list, not in the list itself.
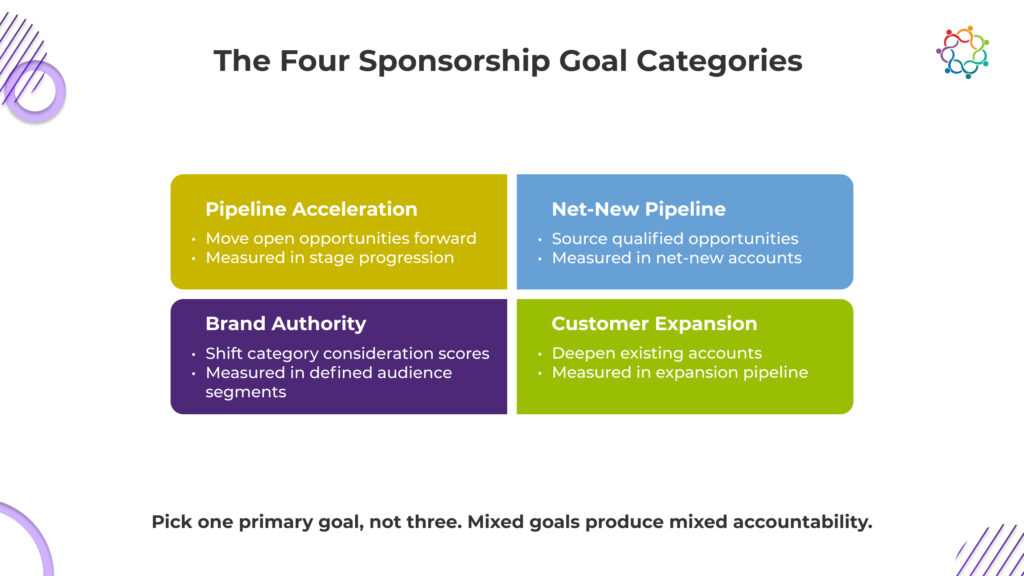
Goals defined before the contract drive every measurement decision downstream. Goals defined after the contract force you to retrofit success criteria onto whatever happened. The first version is a measurement. The second version is a rationalization.
The four sponsorship goal categories.
Pick a primary goal, not three.
Mixed goals produce mixed measurement and mixed accountability. The marketing team ends up reporting on whatever metric looks best after the fact, and the CFO learns to discount the report.
Pick the one outcome the sponsorship has to deliver to be renewed. Secondary goals are nice-to-have. Primary goals are renewal decisions. A sponsorship that “drove brand awareness and supported pipeline and deepened customer relationships” is a sponsorship with no clear verdict at renewal time.
The pre-signing checklist.
Before the contract is signed, four things should be locked:
Common trap: signing first, defining goals later.
The contract is the easiest moment to negotiate access: speaker slots, attendee data, dedicated meeting rooms, and on-site signage. But you only know what to negotiate for if you know what outcome you are optimizing for. Goals defined after signing force you to measure whatever the sponsorship happened to deliver, instead of what you needed it to deliver.
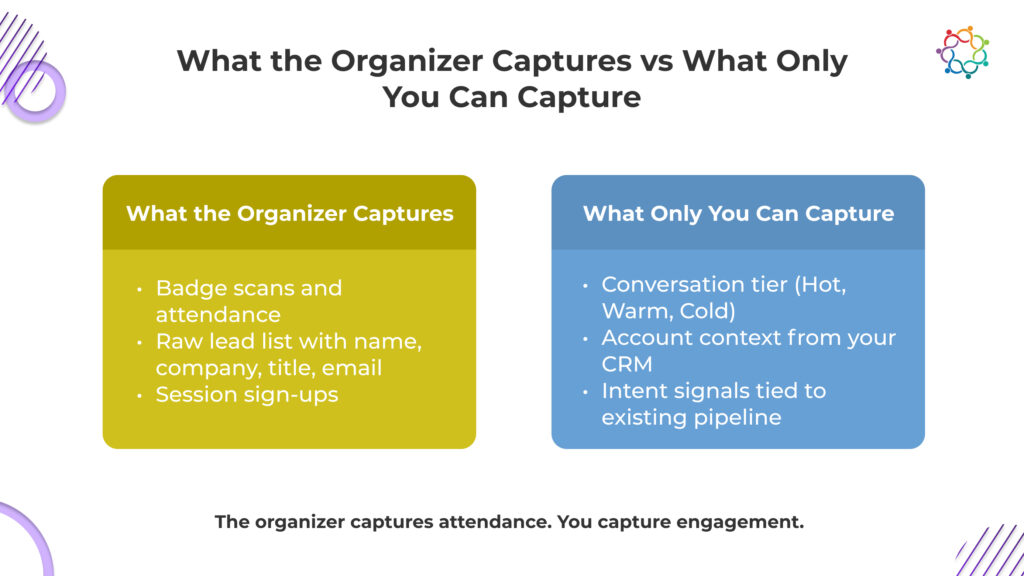
Sponsorship data falls into three layers, and the team that captures all three has a measurable program. The team that captures only the first one has a CSV.
Three data layers every sponsor should capture.
The capture infrastructure.
A mobile lead capture app with custom fields for the sponsorship, synced to the CRM in real time. Session attendance tracked via badge scan at the door, mapped back to your target account list overnight, not three weeks later. Booth conversation summaries are written within 30 minutes of the interaction, never at the end of the day.
This is the operational layer Samaaro is built for: real-time lead capture, session-level engagement tracking, native CRM sync into Salesforce, HubSpot, Microsoft Dynamics, or Zoho, and structured event data flowing into the same dashboards every other channel reports into.
The sponsor-side data that the organizer will not give you.
Conversation tier (Hot, Warm, or Cold). Hot is a named buyer with an active project and an ICP fit. Warm is the right company with no active projects. Cold is curious but low fit. The same three-tier rubric runs across Samaaro’s B2B Field Marketing Playbook and Trade Show Booth Strategy Toolkit. Only your reps can apply this rubric in real time.
Account context. Only your CRM has the open opportunity history.
Intent signal correlation. Only your data team can map event engagement to the existing pipeline.
Common trap: trusting the organizer’s lead list as the only data source.
The list will be raw, ungraded, and stripped of conversation context. Every metric you actually care about (pipeline tier, conversation summary, next-step commitment) has to be captured by your team in real time. The organizer captures attendance. You capture engagement.
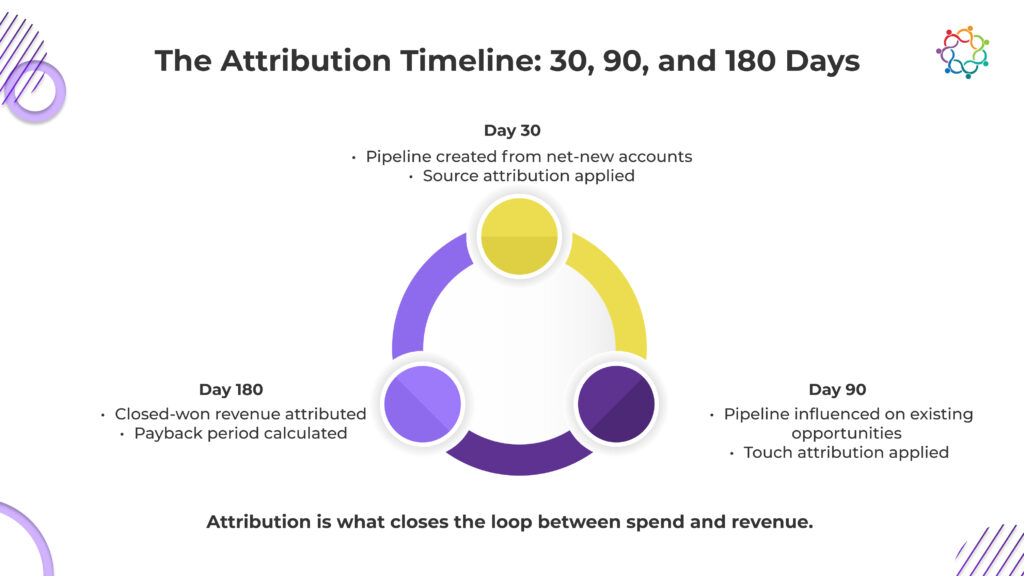
Pipeline attribution is where measurement either becomes defensible or stays decorative. This is the section that survives a CFO review.
The two attribution windows.
30 day window: pipeline created from net-new accounts captured at the event. Fast attribution, clean source crediting.
90 to 180-day window: pipeline influenced. Opportunities that touched the event on the way to close, even if they were already in the funnel. Slower attribution, broader credit.
The attribution model.
Source attribution for net-new accounts captured at the event: full credit to the sponsorship.
Touch attribution for the existing pipeline that engaged at the event: proportional credit, weighted by engagement depth.
Closed-won revenue tagged with sponsorship attribution at 90 and 180 days.
The metrics that survive a CFO review.
The metrics that do not.
Common trap: reporting only first-touch attribution.
A sponsorship that accelerates 10 $100K deals already in the pipeline by 30 days is more valuable than one that sources 50 cold leads. Both belong on the scorecard. Reporting only net-new pipeline systematically undervalues sponsorships of the events your existing customers and prospects actually attend, which is usually the events that matter most. Influence is a measurement. So is sourcing. The framework needs both.
The scorecard is what turns the framework into a one-page document that the marketing leader can take to the CFO. Same format, every sponsorship, every cycle.
The scorecard structure.
The one-page rule.
Every sponsorship gets the same scorecard format, regardless of size. One page. Four rows. One verdict at the bottom: renew, renegotiate, or walk.
No appendix slides. If it does not fit on the page, it does not make the case. The discipline of forcing the report into a single page is what makes the comparison across sponsorships possible.
The reporting cadence.
The verdict moves with the data. A sponsorship that looks weak at Day 7 may look strong at Day 90 once the influenced pipeline materializes. The cadence is what catches that.
The dashboard layer.
All sponsorships are rolled into a single dashboard that the CMO sees alongside every other channel. Year-on-year comparison for renewing events, so the renewal conversation is a comparison, not a memory. Cost-per-opportunity benchmark across the portfolio for relative ranking.
The portfolio view is what turns sponsorship from a series of one-off decisions into a managed channel. The CMO can see which events earn their place every year, which need renegotiation, and which are quietly draining budget.
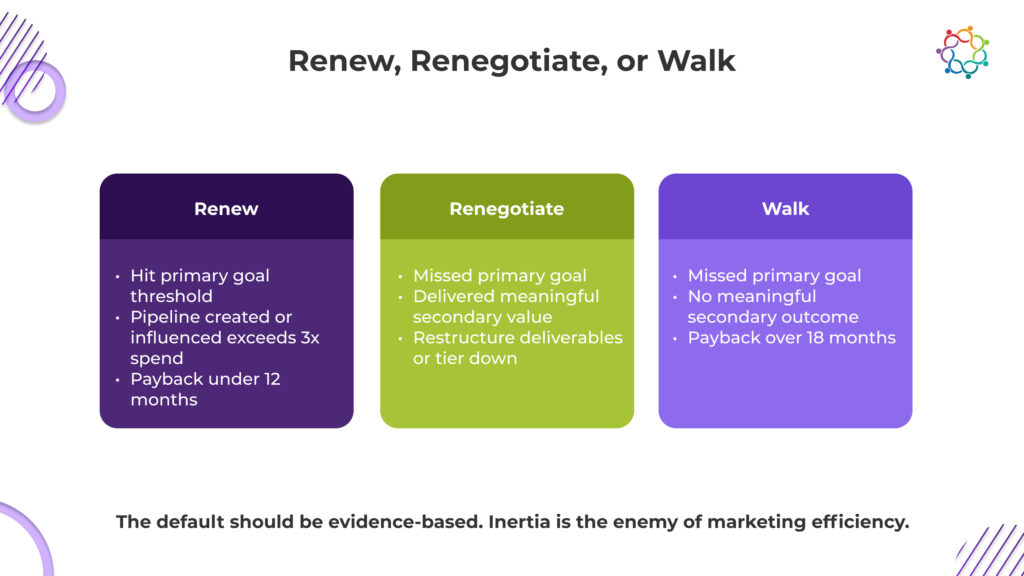
A scorecard with no decision logic is just a slide. The point of the scorecard is to drive a renewal conversation grounded in numbers, not narratives.
The three-way decision.
The thresholds below are recommended defaults for B2B SaaS sponsorships with 6 to 9-month sales cycles and mid-market ACVs. Teams with longer enterprise cycles or higher ACVs should adjust the numbers upward. The structure of the decision matters more than the specific values.
The relationship trap.
The most common reason teams keep sponsoring underperforming events is internal politics. A senior leader’s relationship with the organizer. A customer who speaks at the event. The comfort of brand visibility. None of those are pipeline arguments.
The scorecard’s job is to force the renewal conversation onto numbers. A weak sponsorship that gets renewed three years in a row out of relationship inertia is a quiet six-figure drain on the pipeline budget. Inertia is the enemy of marketing efficiency.
Common trap: renewal as the default.
The default should be evidence-based. Data either supports renewal or it does not. Walking away from a poor-performing sponsorship is not a failure of the marketing team. It is the function of measurement to work correctly.
Event sponsorship measurement is a system. Goals before signing. Data during. Attribution after. Scorecard at the end. Marketing leaders who cannot defend a sponsorship in numbers should not be writing the check. The framework above is how you defend it, or how you decide not to.
Everything above, expanded into the full 12-page Event Sponsorship Measurement Toolkit: the framework, the 15-point pre-signing checklist, the one-page scorecard template, the renewal decision matrix, and the ROI calculator.