Samaaro + Your CRM: Zero Integration Fee for Annual Sign-Ups Until 30 June, 2025
- 00Days
- 00Hrs
- 00Min
1
2
3
→
Bottom Line:
One slide, five numbers, one verdict per show survives the next budget cycle.
Activity Isn’t ROI. Your CFO Knows the Difference.
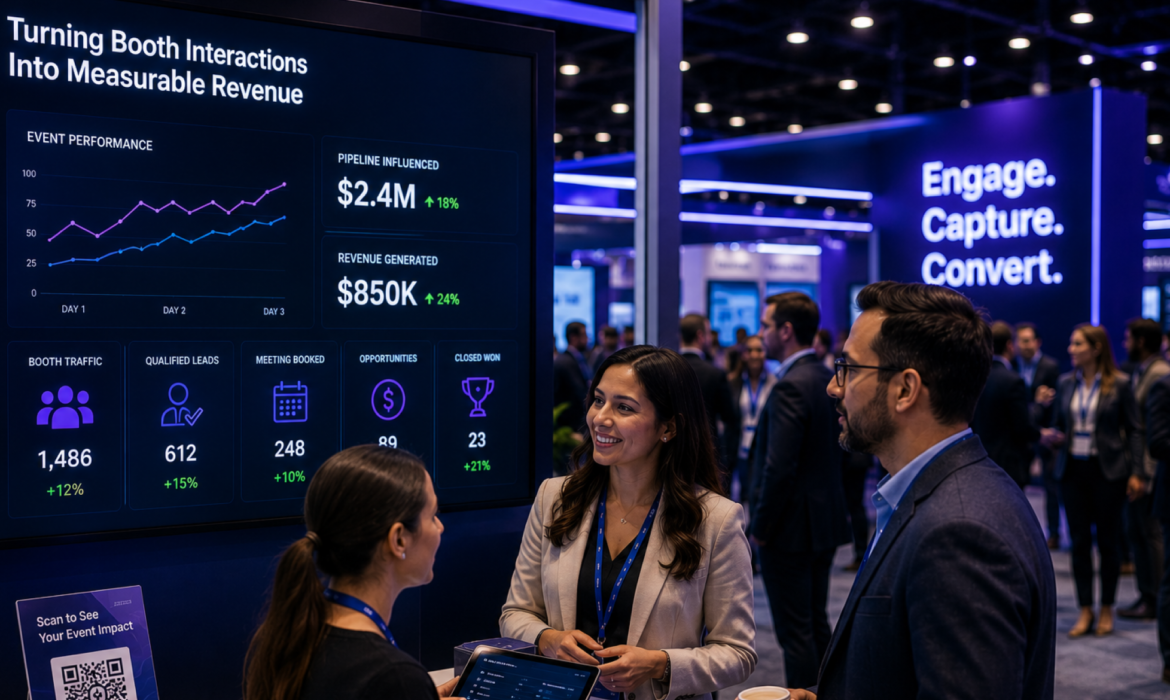
You’re reviewing your own post-show report from last quarter. Forty-seven slides. 1,140 leads. Eight hundred photos. Three industry awards. The deck is impressive. Now read it back from a CFO’s chair. None of it answers the question the CFO is going to ask: what did this produce in revenue?
This is the gap between activity reporting and ROI reporting. Knowing how to measure trade show ROI properly means using five metrics that tie booth activity to commercial outcomes: target account meetings booked, qualified opportunities created, influenced pipeline, deal acceleration, and cost-per-meaningful-conversation. The standard metrics (cost-per-lead, badge scans, impressions) measure activity, not revenue contribution.
This guide explains why the common metrics mislead, defines the five that actually defend the investment, and shows how to read them as a system.
Four metrics dominate the standard post-show report. Each is structurally weak when held up to a pipeline review.
Cost-per-lead. Total spend divided by total leads captured, with every lead treated as equivalent. A lead from an ICP-matched senior buyer with an active project is worth orders of magnitude more than a lead from a curious student with a personal Gmail address. Cost-per-lead masks the quality distribution and produces favorable-looking numbers for trade shows that captured lots of low-quality leads.
Total badge scans. Visitor volume, not visitor relevance. A booth that scanned 800 unqualified badges produces less pipeline than one that scanned 200 with conversation context. Volume flatters weak programs and disadvantages selective ones.
Impressions and social reach. Useful for brand teams measuring brand outcomes. Irrelevant for pipeline accountability. Reporting impressions in a pipeline review tells the CFO this isn’t a pipeline channel after all.
Total leads delivered. The headline number marketing teams default to. Says nothing about quality, fit, or commercial outcome. The CFO can’t translate “leads delivered” into ARR, which makes the metric structurally undefendable.
The structural problem is the same across all four: they measure what’s easy to measure, not what determines pipeline. They flatter activity-heavy programs and penalize selective ones. A trade show portfolio managed against these metrics optimizes for the wrong outcomes year over year.
What it measures. The number of pre-booked or on-site meetings held with stakeholders from your defined target account list during the show.
How to calculate. Count meetings (pre-booked plus walk-up qualified) where the attendee is from a CRM-tagged target account, with a minimum 15-minute structured engagement and a defined next step.
Why it matters. Target-account meetings are the highest-correlation early signal for downstream pipeline. ICP-buyer time-on-conversation directly predicts opportunity creation, which makes this the metric that separates well-targeted programs from broadcast ones at the leading-indicator stage.
The pitfall. Counting any conversation as a meeting. A meeting requires 15+ minutes of structured engagement with a clear next step. Coffee-line chitchat doesn’t qualify.
Where to set your own threshold. Calculate the target-account meeting volume your AE team would need to justify the time they’re committing to the show. Use your historical opportunity-to-revenue conversion rate to back-solve from the pipeline target. The threshold lives in your own commercial math, not in an industry average.
What it measures. The number of CRM-defined opportunities created within 30 days of the show, with show attribution.
How to calculate. Filter the CRM for new opportunities created in the 30 days post-show, where the source touch is the trade show. Track this number by show, by territory, and by AE.
Why it matters. Opportunity creation is the first hard commercial signal. A meeting that doesn’t become an opportunity in 30 days rarely becomes one later. This is the metric that exposes weaknesses in at-show qualification or post-show routing, both of which are operationally fixable.
The pitfall. Counting MQLs or SQLs as opportunities. Lead-stage labels are too soft to defend in a pipeline review. Only opportunity-stage records count.
Where to set your own threshold. Calculate your team’s average qualified-conversation to opportunity conversion rate from historical post-event data. The threshold for a given show is the rate applied to the qualified conversations the show produced. Variance from that threshold is the diagnostic.
What it measures. Total pipeline value of opportunities that engaged with the trade show (booth visit, scheduled meeting, content download from a show landing page) at any point in the buying journey, not only as the source touch.
How to calculate. In your CRM or attribution platform, surface all open opportunities where any contact attended the trade show. Sum the pipeline value.
Why it matters. Trade shows often accelerate and influence deals that originated elsewhere. Ignoring this contribution underreports the channel’s value. For enterprise programs, influenced pipeline can dwarf source-attributed pipeline in any given quarter.
The pitfall. Double-counting influenced pipeline alongside source-attributed pipeline. Report both, but in separate columns. They answer different questions.
Where to set your own threshold. Look at the ratio between influenced and source-attributed pipeline for the shows that consistently produce pipeline in your portfolio. The ratio that holds for your strongest shows becomes the threshold for the rest. Below it, the show is either too early-funnel or too narrow in audience to influence existing deals.
What it measures. Stage progression on existing opportunities within 60 days of the show, attributed to the show as a contributing factor.
How to calculate. Identify opportunities where a contact attended the show and the opportunity moved one or more stages forward in the 60 days following. Quantify the accelerated value as time saved multiplied by deal size.
Why it matters. For enterprise B2B with 6 to 18-month sales cycles, acceleration value can exceed source-attributed pipeline value. Trade shows often unlock deals stuck in technical evaluation, procurement review, or executive alignment, because the right buying-committee stakeholders are physically present at the same time.
The pitfall. Ignoring acceleration because it’s harder to measure than source attribution. Hardness to measure doesn’t make it less real. It makes the programs that don’t measure it systematically underfunded.
Where to set your own threshold. Take a sample of stalled enterprise opportunities from the last 12 months. Identify which had a buying-committee contact at a trade show during the stall period. Quantify the acceleration value that resulted. That’s the benchmark for your portfolio, calibrated to your actual deal motion.
What it measures. Total trade show spend divided by the number of meaningful conversations, defined as 5+ minutes with a qualified ICP contact, with a conversation summary captured at the booth.
How to calculate. Total program cost divided by the sum of Hot leads plus Warm leads with 5+ minute interactions. Excludes Cold leads, badge scans without conversation, and unqualified contacts.
Why it matters. Corrects for the volume bias of cost-per-lead. Rewards programs that produce fewer but better conversations. This is the metric that flips selectivity from a penalty into a virtue at the budget review.
The pitfall. Defining meaningful too loosely. The qualifying threshold (5 minutes, ICP fit, conversation summary) must be enforced at capture time. Applying it retroactively contaminates the metric.
Where to set your own threshold. Divide your target customer acquisition cost by the meaningful-conversation-to-opportunity-to-customer rate you’ve observed historically. That’s your defensible ceiling on cost-per-meaningful-conversation. Anything above it indicates overspend on the show floor, under-investment in capture infrastructure, or both.
Each metric on its own is partial. Together, they tell the commercial story.
The five-metric reading. Target account meetings booked is the leading indicator of pre-show targeting quality. Qualified opportunities created is the conversion rate of meetings into commercial pipeline. Influenced pipeline is the mid-cycle and late-cycle contribution beyond source attribution. Deal acceleration is the enterprise-cycle acceleration value, often the largest hidden contribution to channel ROI. Cost-per-meaningful-conversation is the selectivity and operational efficiency check.
The CMO-grade ROI slide. One slide. Five numbers. A verdict. Show name, total spend, the five metrics, and a renew, renegotiate, or walk recommendation. Year-over-year comparison for recurring shows, color-coded against your own thresholds. This is the artifact that answers the question the CFO is actually asking.
Diagnostic logic when a number underperforms. Low meetings booked points to pre-show outreach failure. Low opportunities point to at-show qualification or post-show routing failure. Low-influenced pipeline points to late-funnel show-fit failure, meaning the wrong audience for your stage. Low acceleration points to poor target account selection, meaning the right buyers weren’t in the room. High cost-per-conversation points to overspend on the show floor or under-investment in capture infrastructure.
A modern event marketing platform like Samaaro captures the underlying data at the booth, including conversation summaries, tier assignment, and CRM sync, without which the five-metric scorecard can’t be reported with rigor.
Standard trade show metrics measure activity. The five metrics that survive a CFO review measure revenue contribution. Target account meetings. Qualified opportunities. Influenced pipeline. Deal acceleration. Cost-per-meaningful-conversation.
One slide. Five numbers. A renew, renegotiate, or walk recommendation per show. That’s the trade show ROI scorecard that survives the next CFO review, and the trade show portfolio that survives the next budget cycle.
If your post-show deck still leads with badge scans and impressions, the fastest ROI move isn’t a new measurement framework. It’s rebuilding next quarter’s scorecard around the five numbers that actually map to revenue.


