Samaaro + Your CRM: Zero Integration Fee for Annual Sign-Ups Until 30 June, 2025
- 00Days
- 00Hrs
- 00Min

1
2
3
→
Bottom Line:
Leadership remembers one number going the right way, not a tour of the event calendar.
Stop presenting a list of events. Present one program.
You ran a handful of events this quarter: a user conference, a couple of field dinners, a webinar, and a partner roadshow. Different sizes, different stages, each with its own recap sitting somewhere. Now it is QBR day, you have one slot, and leadership wants one answer to one question: what did the event program do this quarter?
A good marketing QBR template answers that by rolling the events into a single program story instead of touring them one by one. The logic is a sequence: pick the one number the whole quarter ladders to, aggregate very different event types fairly, show the quarter-over-quarter trend, and close on what is still in motion and the plan for next quarter.
Recapping one event is the easy part. The hard part is making several different ones add up to a single, defensible story. This piece walks through that synthesis logic, then lays it onto a five-to-seven slide template with a filled-in example you can reuse before every review. Most marketers walk in with a stack of event summaries and leave the room having made leadership do the math. The aim here is to walk in with the program already added up.

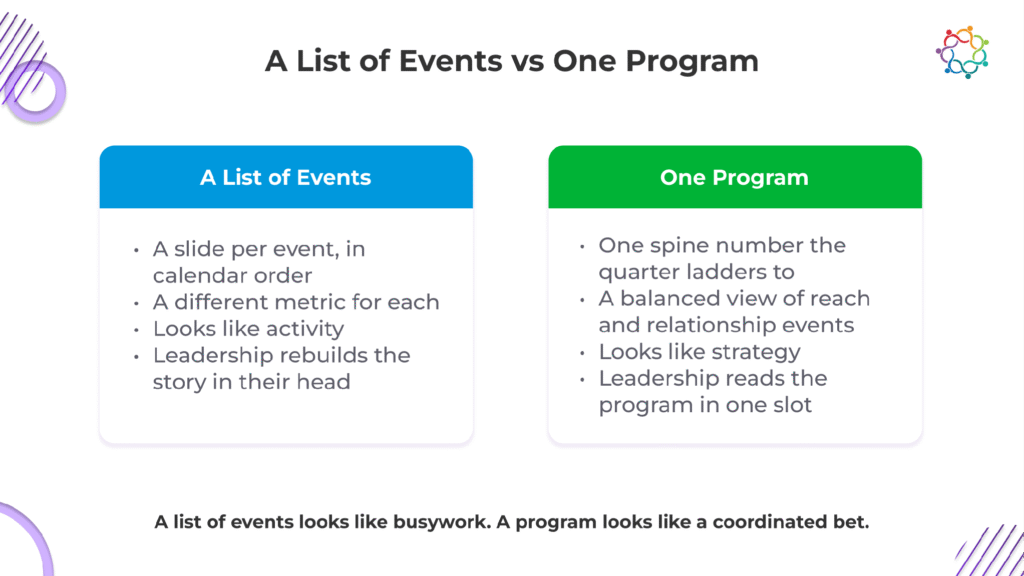
The default is a slide per event: a tour through the conference, then the webinar, then each dinner in turn. That is a stack of recaps, and a stack of recaps is not a review.
It fails for a specific reason. It makes leadership do the synthesis themselves, adding the events up in their heads to work out what the program did, and they will not do that work. So the quarter reads as a pile of activity rather than a coordinated bet. A list of events looks like busywork. A program looks like a strategy. That gap is the whole game, because Gartner found that only 52 percent of senior marketing leaders say they can prove marketing’s value and get credit for it, with CFOs and CEOs ranked as the executives most skeptical of that value. The QBR is the room where you either close that gap or widen it.
So reset the unit. A QBR measures the whole program across the quarter, and each event is a component of that program. That single framing is how to report on an event program quarterly without it sliding back into a list. The deck answers one question once: what did the event program contribute this quarter? The per-event detail still exists and still matters; it just lives in the individual recaps. Those recaps are the input. This quarterly story is the output. For how to build the single-event recap that feeds this roll-up, see our B2B Field Marketing Playbook which sets the wider program context.
The trap is treating the quarterly deck as a folder of event recaps stapled together. The moment leadership sees the event calendar as the agenda; the program has already lost its framing.

Before anything rolls up, the quarter needs one headline number that the whole program ladders into. A deck with a different metric for every event has no through-line, and the review fragments into the same event-by-event tour you were trying to leave behind. A deck where every event feeds one number tells one story.
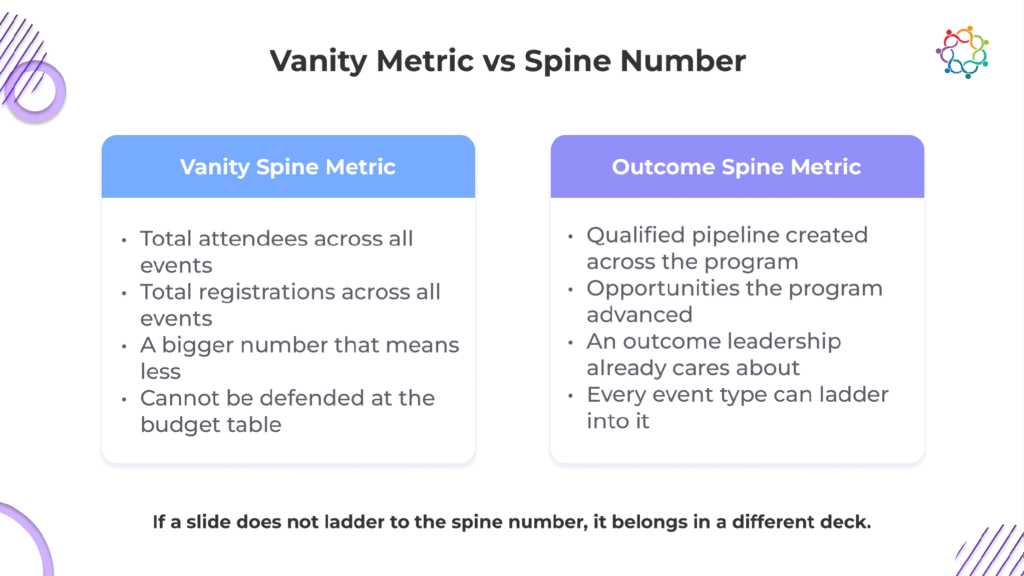
Choose that number on two criteria. It should be an outcome leadership already cares about, and it should be one that every event type can contribute to, so a small dinner and a large conference both ladder into the same figure. Qualified pipeline created across the program, or opportunities the program advanced, both work. Attendance does not, because a dinner and a conference contribute to it on wildly different scales.
That choice sets the discipline for everything after it. Every slide that follows has to support that number. If a slide does not ladder to it, the slide belongs in a different deck. That is most of what to include in a marketing QBR, and most of what to leave out.
The trap is choosing a vanity figure as the spine, total attendance summed across every event. It is a bigger number that means less, and the whole deck inherits the weakness, because a spine built on an activity count cannot carry an outcome story. The spine has to be an outcome that the business already values.

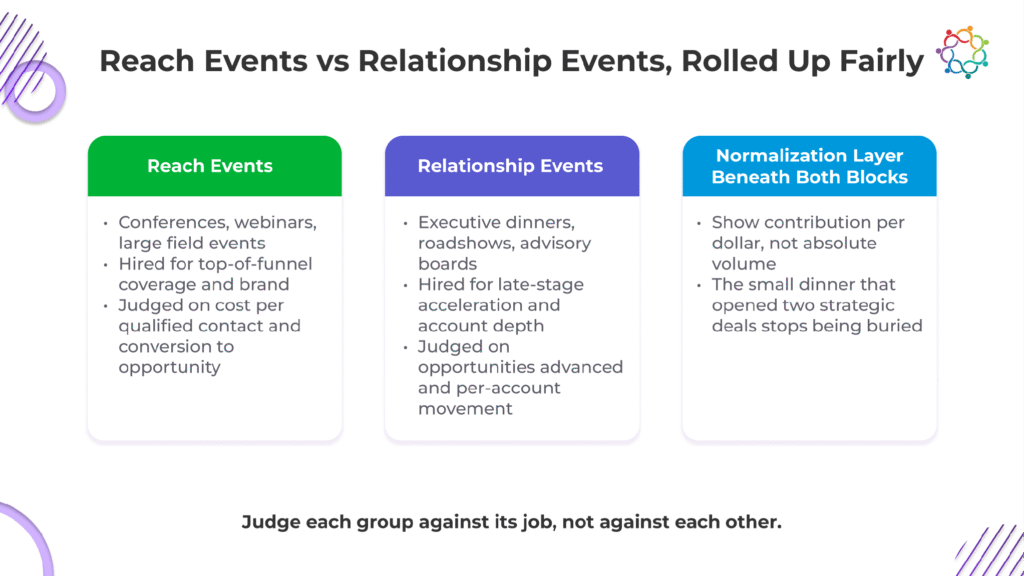
Here is the part a single-event recap never has to handle, and it is how to roll up multiple events for leadership without flattening them: a conference, an executive dinner, and a webinar are not the same kind of thing and adding them up naively misleads. Rolling them up fairly takes three moves:
Done this way, leadership sees a balanced program, reach paired with depth and understands why the mix exists. The alternative is a slide where one big event towers over a row of small ones that look like waste.
The trap is comparing every event on a single volume metric, where the biggest event always wins and the small, high-value ones look like a poor use of budget. That misreads the program and gets exactly the wrong events cut, the intimate dinner that opened a seven-figure account quietly axed because it drew twelve people.

The last section aggregates within the quarter. This one compares across quarters, and it is the axis a single-event recap can never show. A QBR audience wants direction even more than it wants one quarter’s totals: Is the program getting better?
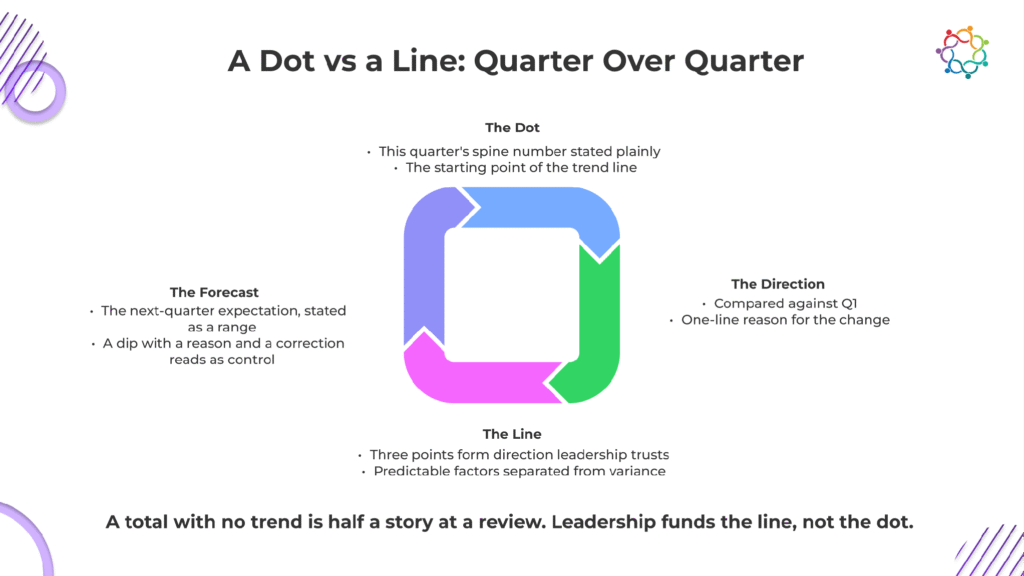
Show it with the same spine number across the last several quarters, the direction of travel, and a one-line reason for any move. Quarter-over-quarter is the comparison that belongs in a review. This is the clearest way to show event ROI in a QBR, because a single quarter’s number is a dot, and the trend is the line. Leadership funds a line heading the right way far more readily than a dot it cannot place in context.
Be honest about a down quarter. A dip with a clear cause and a stated correction reads as a program under control. A dip with no explanation reads as a problem you have not noticed yet. The trend slide is where candor earns trust, so use it that way.
The trap is presenting only this quarter’s totals with no prior quarters at all, which leaves leadership unable to tell whether the program is climbing or sliding. A total with no trend is half a story at a review, and the half that is missing is the half leadership cares about most.

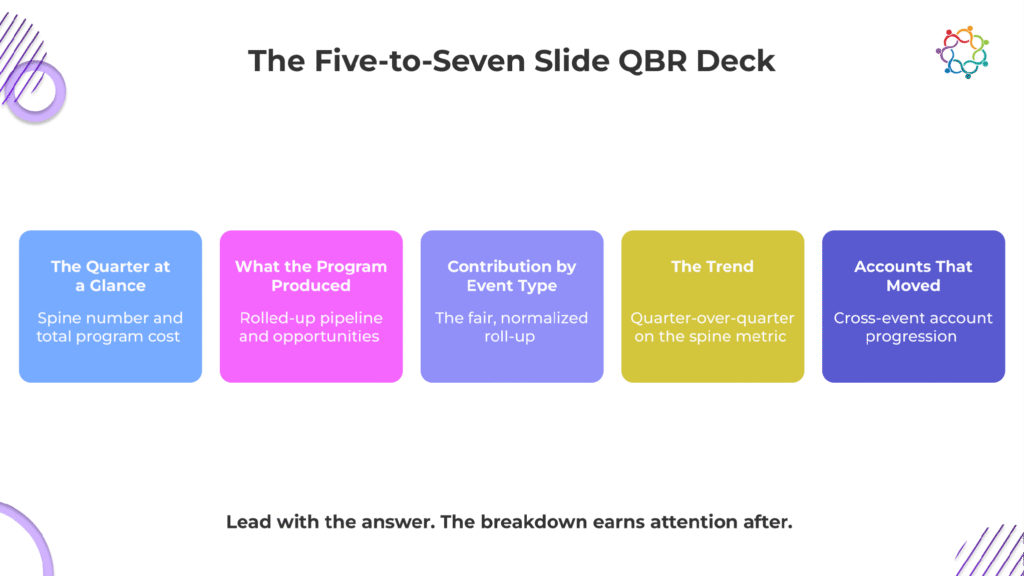
Now lay the logic onto the actual deck. Here is how to build a marketing QBR deck for the event program: five core slides with two optional ones, each slide doing one job.
A few construction rules hold it together. Slides 1 through 5 are the core; six and seven get added when the quarter warrants them, which is how this quarterly event review template flexes from five to seven. One number leads each slide, and the rest of the slide supports it. The order is fixed: the answer, then the breakdown, then the trend, then the accounts, then forward. And every slide stays skimmable, because the event program gets one slot in a packed QBR.
The trap is opening with the event calendar or the logistics instead of the spine number, which buries the answer behind the setup. Lead with the answer. The breakdown earns attention once the answer is on the table.
The program section said build a program. This one guards the other end: the ways a roll-up quietly collapses back into the list you were trying to escape.
It happens in a few predictable ways. A slide per event undoes the whole roll-up and turns the deck back into the tour. Per-event detail overload, every event’s metrics dumped onto the deck, drowns the program story, and that detail belongs in the individual recaps. Slides that do not ladder to the spine number turn the deck into a scrapbook. And vanity roll-ups, total impressions or registrations added up across events, hand you a big number that says nothing. If you have seen marketing QBR deck examples that fall flat, most of them do at least one of these.
The discipline is simple to state: every slide ladders to the spine number, the trend is present, and per-event detail is linked rather than shown. This deck also has to survive the finance questions leadership will bring to it, so build it to answer them, and the same measurement discipline runs through the Event Sponsorship Measurement Framework.
The instinct that does the quietest damage is trying to give every event its fair share of airtime. The deck’s job is clarity for leadership, and the events that carry the story are the ones that earn the slide time. The rest live in the appendix or in their own recaps.
Pull it together. One program built from the quarter’s events. One spine number the whole quarter ladders to, a fair roll-up of different event types, the quarter-over-quarter trend, on five to seven slides.
Leadership does not remember the quarter as a list of events. They remember it as one number going the right way, or the wrong one. The QBR deck is where you decide which.
The five-to-seven slide template, along with a fully populated example quarter so you can see what good looks like, is in the Quarterly Event QBR Deck. It takes your first name, work email, company size, and role.
To see how running every event on one platform makes this roll-up trivial instead of a quarter-end scramble, book a walkthrough.

Samaaro is an AI-powered event marketing platform that enables marketing teams to turn events into a measurable growth channel by planning, promoting, executing, and measuring their business impact.
Location


© 2026 — Samaaro. All Rights Reserved.