Samaaro + Your CRM: Zero Integration Fee for Annual Sign-Ups Until 30 June, 2025
- 00Days
- 00Hrs
- 00Min

1
2
3
→
Bottom Line:
Fragmentation is the root cause behind all four strains; fix the data layer first.
What B2B teams spend on events, and what they get back.
B2B teams are pouring budget back into events, then struggling to say what those events returned, where the leads went, and which of the tools they used actually held the data. To map where event marketing stands in 2026, we did two things. We talked to nine B2B marketers in depth, and we pulled the broader industry benchmarks.
Read together, the B2B event marketing statistics for 2026 point to three consistent strains. Spend is heavy and hard to prove. A single event runs across a stack of disconnected tools. And the interest captured at the event leaks away before sales act on it. Those are the biggest challenges in B2B event marketing this year, and they are connected.
This report follows the money and the work in four parts: how much teams spend, how many tools they run to pull off one event, what they lose in the gap afterward, and why the proof keeps going missing. The hard numbers come from cited industry sources. The texture, the part that explains why, comes from the nine conversations. We name that split up front on purpose, because that transparency is what makes the rest of the report worth trusting. The full 25-page report, plus a scorecard to benchmark your own program, is at the end.
This is our read on the state of B2B event marketing in 2026, and a benchmark is only as trustworthy as its method, so here is ours in plain terms.
One line on how to read this, because it is where research like this usually goes wrong. Nine conversations are a deep qualitative signal. We report them as patterns and direct quotes, never as percentages, because that is what a sample of nine can honestly support. We do not say “73 percent of marketers” off nine calls, and neither should you. The scale comes from the broader data, and the why comes from the conversations. Keeping that line clean is what separates a report that gets cited from one that gets picked apart.

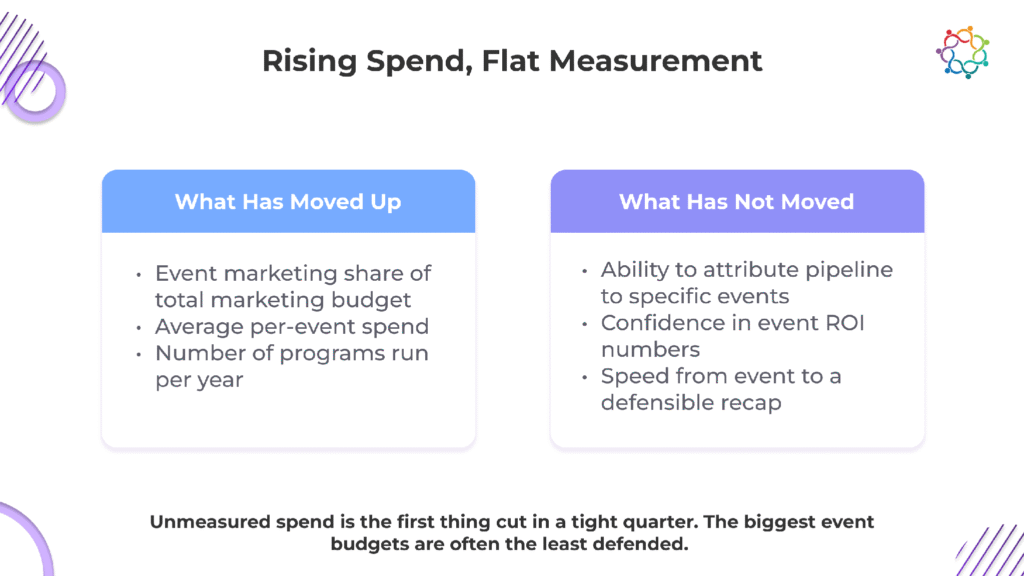
Start with the money, because events are a major bet. In Forrester’s 2026 analysis of B2B event budget allocation, events command a serious share of program spending. Across sectors like manufacturing, production, and professional and technology services, close to half of the teams Forrester surveyed put more than 30 percent of their entire program budget into events. If you want a sense of how much B2B teams spend on event marketing, this is it. Events are a top-tier marketing line, the kind finance scrutinizes closely, and they held their place while other budgets got squeezed.
The nine conversations put a face on what that spending feels like to carry. The leaders we spoke with treated events as one of the largest line items they personally had to account for, and the recurring theme was funding the next event off the results of the last one. The budget conversation was never abstract. It was a quarterly question of whether the last event had earned the next one.
The trouble is what sits next to that rising spend. The ability to prove the return has not kept pace. When the spend climbs faster than the proof, that gap turns into exposure. The more a team pours into events, the more it rides on the moment someone asks what came back. And unmeasured spend is the first thing cut in a tight quarter, so the biggest event budgets often turn out to be the least defended.

If the money tells you events matter, the tooling tells you how chaotic running them has become. The backdrop is an ecosystem out of control: the martech landscape now catalogs more than 14,000 separate tools and Gartner’s marketing technology survey found marketers using just 33 percent of the capabilities they already own, down from 42 percent two years earlier. Teams accumulate tools faster than they can connect or use them.
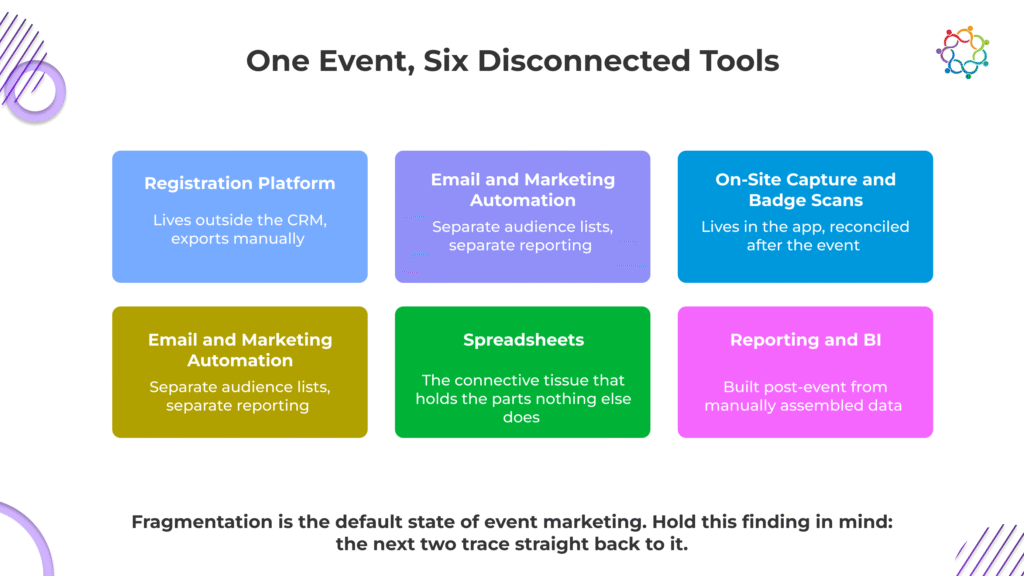
If you have ever wondered how many tools marketing teams use for events, the honest answer is rarely one. Across nearly every one of the nine conversations, the same handful of tool types showed up to run a single event:
One marketing operations manager at a B2B software company listed the stack for a single event without pausing: “Pardot. Gmail. Slack. WhatsApp. Manual upload.” None of those tools talked to each other, so a person became the connection between them.
This was never framed as a deliberate choice. It was just how running an event works now. and it matters because this fragmentation is the default state of event marketing. No one designs it; it accumulates, and it is the root cause sitting under the rest of this report. When the data for one event lives in six places, no single one of them can tell the whole story. Hold this finding in mind for the next two, because both trace straight back to it.

The third strain is where the value actually escapes. Post-event follow-up is where the math turns against you, and the data on follow-up speed is brutal. Harvard Business Review’s study of online sales leads, built on an audit of more than two thousand companies, found that firms reaching a lead within an hour were nearly seven times more likely to qualify it than firms that waited just an hour longer, and more than sixty times more likely than those that waited a full day. The same research put the average company’s response time at around 42 hours.
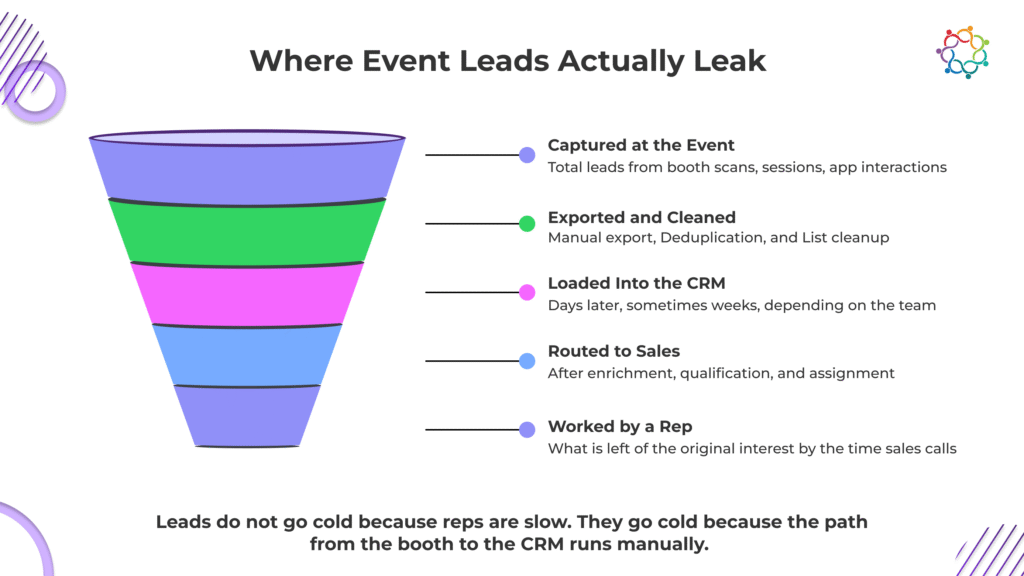
Now set that against how event leads actually move. In the nine conversations, the post-event window was where value visibly drained. Leads sat while someone exported them from the registration tool, deduplicated the list, cleaned the fields, and only then handed them to sales. The gap between “the event ended” and “sales have the lead” was measured in days, sometimes weeks. As one marketing leader at an enterprise IT services firm put it, “It’s all people driven. Nothing is standardized.” Every event, the handoff got rebuilt by hand.
The shape of the loss matters. It is a sharp drop in the first days, when the lead is hottest and the manual handoff is slowest, rather than a slow trickle over months. So the loss is really a handoff-speed problem. Leads go cold during the days when the export and upload are run by hand, and the same fragmentation from the last finding shows up here as lost revenue. Speed up the handoff and the leak shrinks on its own.

All of this converges on one question marketers keep getting asked and keep struggling to answer. If you are looking for the central event marketing attribution statistic, it is this: Forrester’s State of B2B Events research finds that proving event ROI sits at the very top of event teams’ priorities, named by roughly 95 percent of them, even as event budgets come under strain precisely because teams cannot readily demonstrate that value. The single most-wanted number is the one hardest to produce.
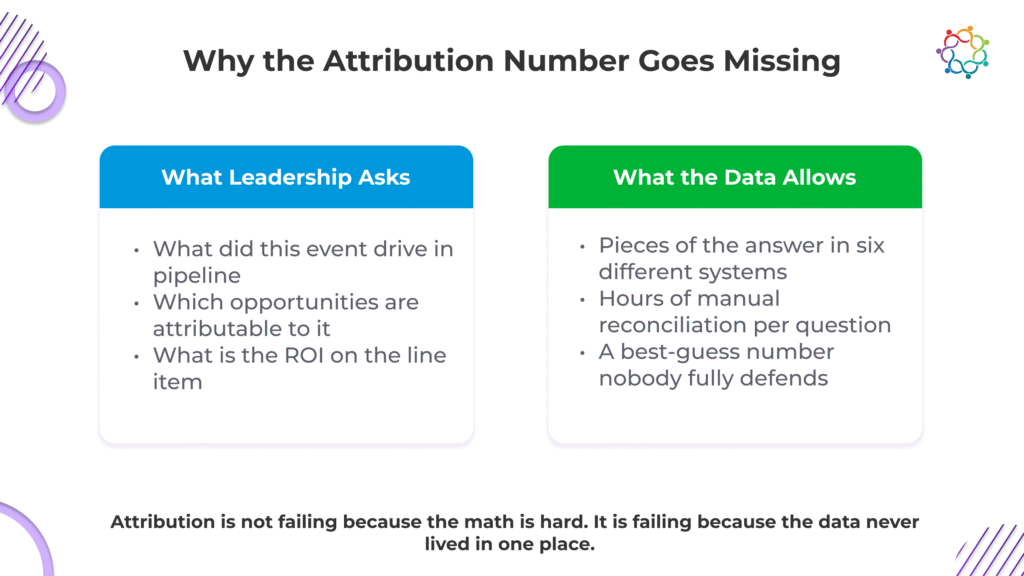
In the nine conversations, this was the most consistent leadership refrain. In different words across different calls, the question that kept landing was some version of: where are the numbers? A marketer would be asked, in the room, what the last event drove, and would not be able to assemble the answer on the spot. In that room, not having the number reads as the event not working, even when it worked.
It is worth being precise about why the number goes missing. Attribution fails here for one reason: the data never lived in one place. Reconstructing it after the fact, pulling from the registration tool, the CRM, and the spreadsheet and matching it all by hand, becomes the actual job, and there is rarely time for it before the next event. Put the data in one place as the event runs and the number stops going missing. This is the same measurement-principle continuity that our Event Sponsorship Measurement Framework, from the May cluster, applies to sponsored events.

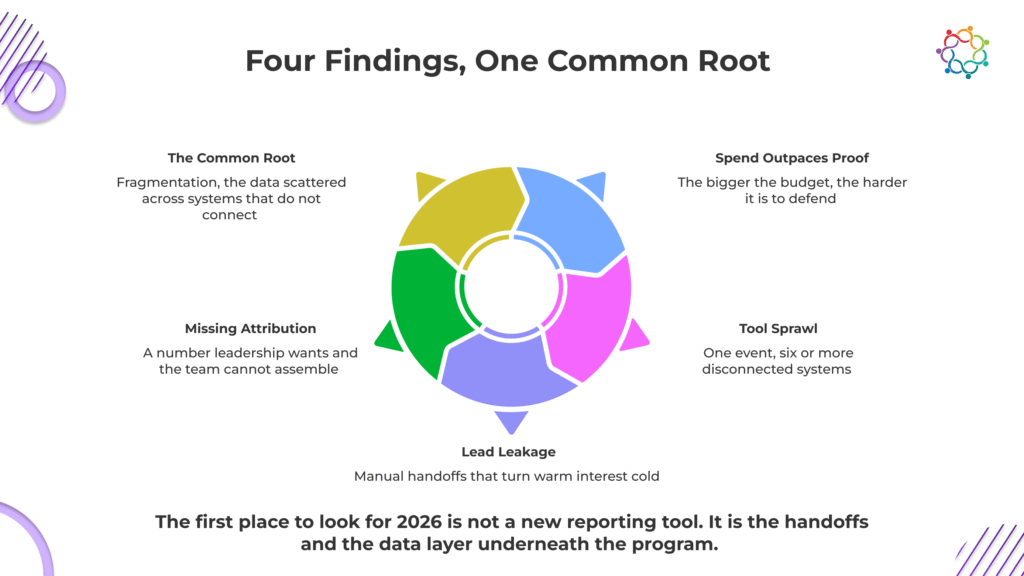
Step back, and the four findings line up into a single picture:
The common root is plain, and it is the defining B2B event marketing challenge of 2026: fragmentation. The spend cannot be measured, the leads leak, and the number goes missing for the same underlying reason. The data is scattered across systems that do not connect, so it has to be stitched together by hand, late, every time.
The direction of travel, as a category trend, is toward consolidation. Teams are starting to run the whole event lifecycle, plan, promote, run, and measure, on fewer connected systems, so the data is captured as the event happens. For anyone planning a 2026 program, that points the first move at the data layer underneath the program and the handoffs between tools, before any new reporting tool gets bought.
Pull the through-line together. Spend is up, the tools are scattered, the leads leak, and the proof goes missing, all for the same reason, which is where the data lives.
Events are the biggest bet most B2B teams make all year. The teams pulling ahead in 2026 are not the ones measuring harder after the fact, but the ones that moved the whole event into one place, so the data is there the moment leadership asks for it.
The full picture, every finding expanded with its cited benchmark and a scorecard to see how your own program compares, is in the 25-page 2026 B2B Event Marketing Benchmark Report. Download it below. It takes your first name, work email, company size, and role.
To see what running events in one place looks like in practice, book a walkthrough.

Samaaro is an AI-powered event marketing platform that enables marketing teams to turn events into a measurable growth channel by planning, promoting, executing, and measuring their business impact.
Location


© 2026 — Samaaro. All Rights Reserved.