Samaaro + Your CRM: Zero Integration Fee for Annual Sign-Ups Until 30 June, 2025
- 00Days
- 00Hrs
- 00Min

Imagine pouring your heart and soul into planning an event, but the impact is unclear. Were your efforts a hit, or a miss? This happens all too often when event organizers fail to track and measure success. But it is possible to overcome this situation. By focusing on Key Performance Indicators (KPIs), you can transform your event from a guessing game into a data-driven triumph.
The challenge for event organizers lies in accurately gauging the impact of their efforts. Did your marketing campaign reach the right audience? Were attendees engaged during the event? Without measurable data, it’s impossible to answer these questions and improve future events.
KPIs are the solutions for these problems. They provide valuable insights into various aspects of your event, allowing you to identify strengths, weaknesses, and areas for improvement.
Tracking KPIs unlocks a treasure trove of benefits. It lets event organizers maximize return on investment (ROI), boost attendee engagement, and plan future events with laser focus. KPIs equip you with the knowledge and power to achieve these goals and more.
In this blog, we’ll explore five essential metrics that will transform your event optimization journey:
KPIs, or Key Performance Indicators, are quantifiable metrics that track your progress towards achieving specific event goals.
SMART Goals
Before diving into KPIs, it’s crucial to establish SMART goals (Specific, Measurable, Achievable, Relevant, and Time-bound). These goals act as a roadmap, guiding you in choosing relevant KPIs to track success. For example, a SMART goal could be “Increase event registration by 20% within the next quarter.” The corresponding KPI would be the “Registration Rate.”
Metrics vs. KPIs
It’s important to distinguish between metrics and KPIs. Metrics are raw data points, like the number of website visitors. KPIs, however, tell a story. By analyzing metrics (e.g., website traffic) and interpreting them through the lens of KPIs (e.g., attendee engagement), you gain valuable insights into your event’s effectiveness.
A. Pre-Event KPIs
The groundwork for a successful event is laid well before the first attendee arrives. Pre-event KPIs offer a crucial window into the effectiveness of your marketing efforts, audience engagement, and overall event readiness.
1. Registration Rate
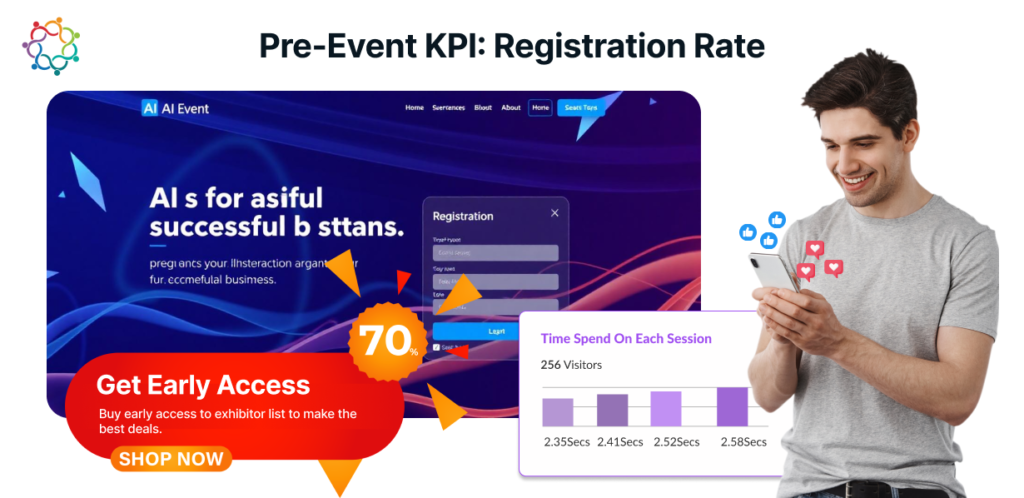
The registration rate simply refers to the percentage of website visitors who convert into registered attendees for your event. Mathematically, it’s calculated as:
Registration Rate = (Number of Registered Attendees) / (Total Number of Unique Website Visitors) x 100
This metric provides a quick snapshot of how well your event website and marketing efforts are enticing visitors to take the next step and commit to attending.
Strategies to Boost Registration Rates
Here are some key strategies to significantly improve your registration rate:
Importance of Registration Data Analysis
Analyzing the registration data goes beyond a simple percentage. By digging deeper, you can gain valuable insights that inform future event planning:
2. Website Traffic and Engagement
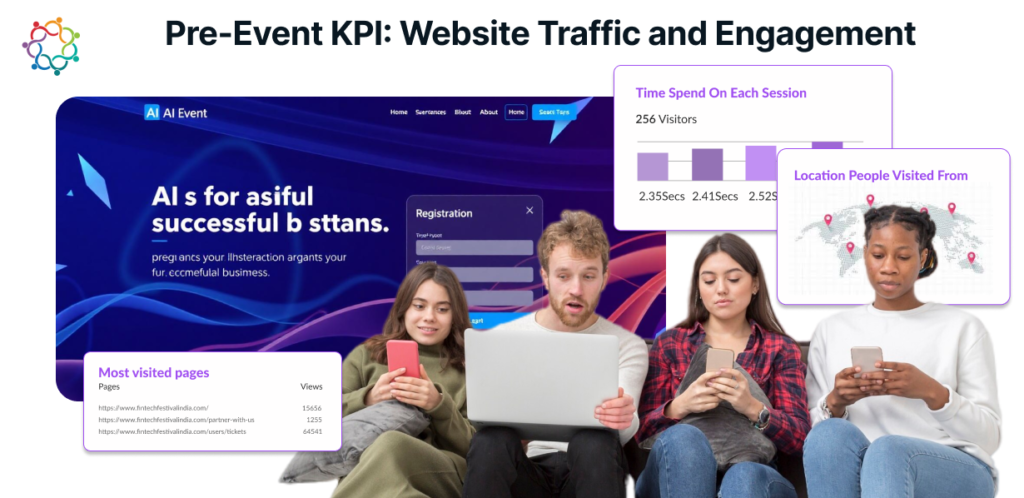
Website traffic and engagement metrics provide a window into how visitors interact with your website, revealing valuable insights into their needs and preferences.
How Engagement Metrics Guide Website Optimization
By analyzing website traffic and engagement data, you gain valuable insights into:
How Website Data Drive Personalized Marketing Efforts
Website data empowers you to personalize your marketing efforts and convert visitors into registered attendees:
B. During-Event KPIs:
During-event KPIs serve as a real-time pulse check on your event’s effectiveness. This allows you to identify areas for improvement on the fly and optimize the event experience in real-time.
3. Event Check-In Rates

Tracking check-in rates lets you gauge how many registered attendees actually participate in your event. Low check-in rates might indicate logistical issues or last-minute cancellations.
Check-In Improvement Strategies
Low check-in rates can be frustrating for both the attendees and event organizers. Here are some strategies to ensure a smooth and efficient check-in process:
Importance of Check-In Data Analysis
Analyzing check-in data goes beyond raw numbers. By diving deeper, you can identify areas for improvement in future events:
4. Session Attendance and Engagement

Session attendance rate is the percentage of registered attendees who participate in a particular session. Engagement metrics can include Q&A participation, polling results, and audience interaction during presentations.
Both session attendance and engagement metrics reveal how well your content resonates with the attendees and translates into a stimulating and interactive learning experience.
Strategies to Boost Session Engagement
The key to maximizing session engagement lies in creating a dynamic and interactive learning environment. Here are some strategies to ignite attendee participation:
How Session Data Leads to Content Optimization
Analyzing the session attendance and engagement data provides invaluable insights for future events:
C. Post-Event KPIs
Post-event KPIs offer a retrospective look at your event’s impact and the attendees’ sentiment. These metrics delve beyond simple attendance numbers to reveal the true value your event generated.
5. Attendee Satisfaction
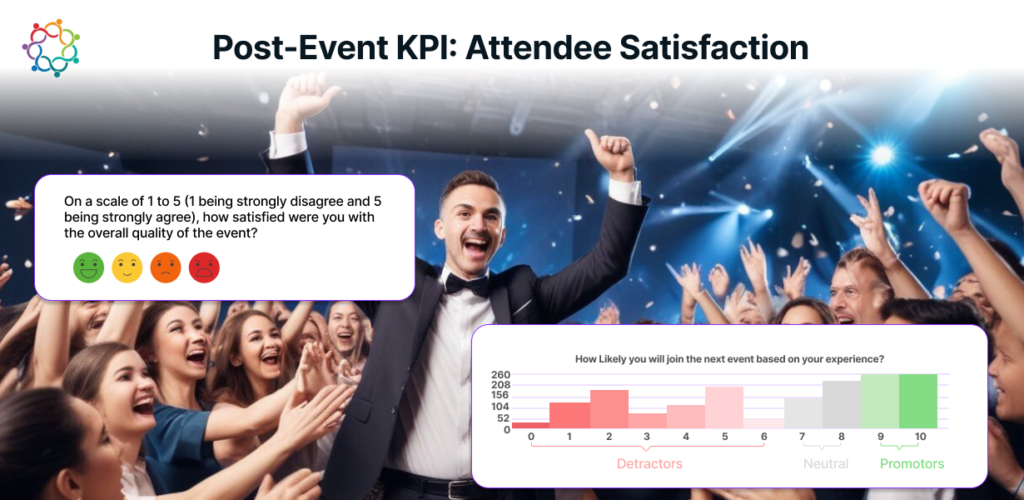
Attendee satisfaction reflects how well you delivered on your promises, created a valuable experience, and nurtured lasting connections with your audience. Measuring the attendee satisfaction goes beyond vanity metrics. It provides invaluable insights that empower you to:
Methods to Capture Feedback
There are several effective methods to gauge attendee satisfaction and gather valuable feedback:
Importance of Feedback Analysis
Analyzing attendee feedback allows you to identify aspects of the event that exceeded expectations and areas that fell short. This feedback serves as a roadmap for refining future events:
How Feedback Assists Event Personalization
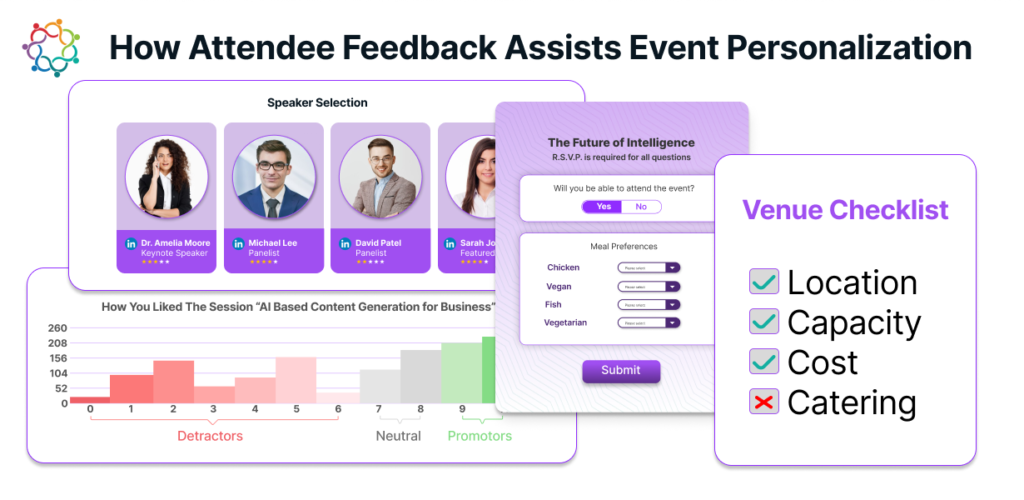
Utilize the attendee feedback to personalize future event experiences and create a more engaging and satisfying experience.
IV. Tools and Resources for Tracking KPIs
The good news is that you don’t have to become a data scientist to track KPIs. Several event management platforms and analytics tools simplify the process. Popular options include Samaaro, Eventbrite Analytics, Cvent, and Bizzabo. These platforms offer features like automated reporting, data visualization tools, and dashboards that make KPI tracking and analysis child’s play.
For budget-conscious event organizers, there are several free or low-cost alternatives. Google Analytics provides valuable website traffic and engagement data, while tools like SurveyMonkey and Typeform can be used to gather attendee feedback through surveys.
V. Conclusion
By embracing KPIs, you can transform your events from one-time occurrences into data-driven success stories. Ready to transform your event optimization journey? Subscribe to our newsletter for more insightful event planning tips and downloadable resources on topics like KPI tracking. Book a demo and start your free trial of Samaaro’s platform to see how data can power your events.

Built for modern marketing teams, Samaaro’s AI-powered event-tech platform helps you run events more efficiently, reduce manual work, engage attendees, capture qualified leads and gain real-time visibility into your events’ performance.
Location
© 2026 — Samaaro. All Rights Reserved.